hellomango
May 10, 2019
Writing Feedback / IELTS TASK 1: NEW RESIDENTIAL CONSTRUCTION [3]
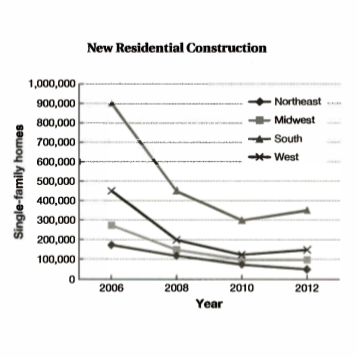
THE NUMBER OF SINGLE-FAMILY HOMES CONSTRUCTED IN THE US BY REGION OVER A PERIOD OF SIX YEARS
The line graph illustrates the number of single-family houses built in various regions of the United States over a period of six years from 2006 to 2012. According to the graph, there was a significant decrease in the number of houses constructed in different areas of the United States at various time, most of the regions seem to follow the same rising and falling trends.
There is a significant difference in the number of houses built in each region. As can be seen, the South had the highest figure for new residences, while the Northeast had the least number of homes out of the four regions. After 2010, the number of new homes in the West continued to fall and get the lowest number out of the four areas.
The figure for new residences in different areas changed over each year, tend to decrease over six years. The highest number of new houses built in 2006 in all regions and three out of the regions get the lowest point in 2010. Most regions had the number of homes decreased significantly in 2006 and hit the lowest point in 2010, then surged slightly or remained constant until 2012.
Thankyou for your feedback.

Newresidentialcons.png
