Muhayyun Mappare
Dec 29, 2016
Writing Feedback / IELTS WRITING TASK 1, Table of Proportion of children in Australia [3]
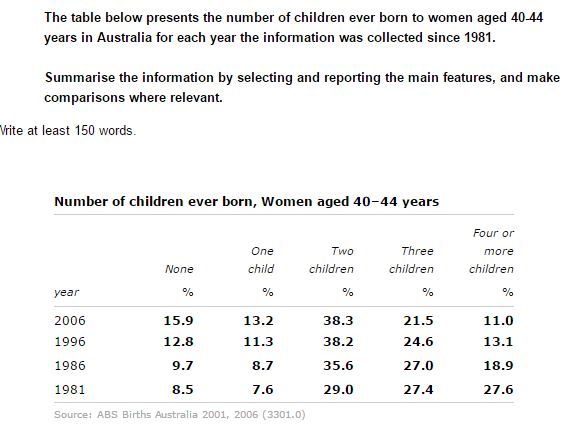
The table provides the data of the proportion of children delivered by women with the age of 40-44 in 1981. Overall, it can be seen that the woman delivering children with none, one child, and two children chategories experienced an increasing trend, while the reverse witnessed in the remaining data.
The two children category was dominated in 1981 and was followed by The one and the none child chategories. However, in the next 25 years of the growth of children, The two children still dominated in 38,3% while the none children in 15,9% which opposited the one children chategories in 15,9%.
On the other hand, the four or more and the three children category grew up in 1981. Nevertheless, the three children chategory had experienced to increase gradually from 27,4 to 21,5% in 2006 while the four or more children chategory declined moderately from 27,6 to 11,0% in 2006.