Unanswered [20] | Urgent [0]
  

Posts by Dayat
Name: Hidayat
Joined: Dec 28, 2016
Last Post: Dec 30, 2016
Threads: 2
Posts: 4  
Likes: 1
From: Indonesia
School: University of New Shouth Wales

Displayed posts: 6
sort: Oldest first   Latest first  | 
Dayat   
Dec 28, 2016
Writing Feedback / The spending for education, health and human resources, environmental services and transportation. [3]

Writing IELTS TASK 1 the title of spending by local authorities in several lands

The pie charts display that the experts some of fields which changed per decade in 1980, 1990, and 2000. It is clear that the percentage of higher education, and health and human resources were the biggest proportion in every decade. While, the percentage of other fields were increasingly and decreasingly trend in every decade.

In 1980, the percentage of higher education was nearly a third and it was increasingly becoming 45% in 1990, then it was decreasingly trend 40% in 2000. The health and human resources were increasingly trend 14% in 1980 and it increased significantly 20% in 1990, then it decreased 10% in 2000. And, the percentage of transportation 16% in 1980 and it plunged slightly in 1990 then it was increasingly trend 22%.

On the other hand, the percentage of K-12 education was 25% in 1980 and it decreased 20% in 1990, then it was also decreasingly trend 18%. The percentage of other was 6% in 1980, then it was decreasingly trend 4% in 1990 and 1% in 2000. While, the environmental services were 4% in 1980 and it increased 5% in 1990, then it was decreasingly trend 1% in 2000.
Dayat   
Dec 28, 2016
Writing Feedback / IELTS Task 1 Annual Expenses by Local Bureaucracy in Several Lands [2]

Hallo Mr.Citra, Good night, i have some corrections for you.

Expenses of environmental services were rose 1% in the first ...

The correction is (Expenses of environmental services rose 1% in the first 10 years from 4% to 5% and rose again 4% in the second 10 years from 5% to 9%)

... and human resources was decline to 10%.

The correction is (However, in the last decade health and human resources declined to 10%)
Dayat   
Dec 30, 2016
Writing Feedback / IELTS WRITING TASK 1, Table of Proportion of children in Australia [3]

Hy Mahayyun Mappare, good afternoon, i have some corrections in grammatical of your writing.

The table provides the data of the proportion of children delivered by women with the age of 40-44 in 1981.

the correction, this sentences is not clear enough, if you want to use the complex sentence and to make easier for reader to read your writing, you should use conjuction in this sentences.

like this one (The table provides the data of the proportion of children which were ever born by women in Australia with the age of 40-44 in 1981

Thanks
Hope you much success.
Regard.
Dayat   
Dec 30, 2016
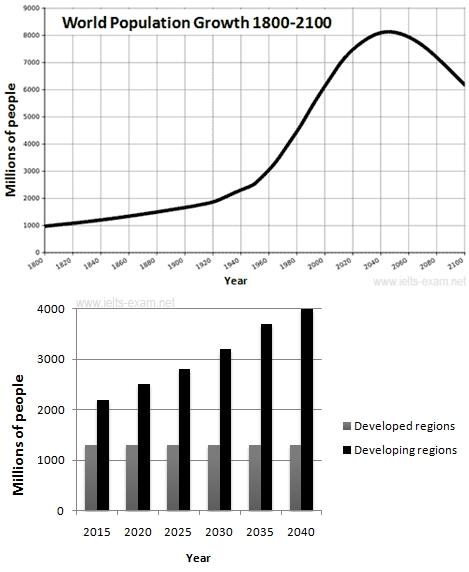
Writing Feedback / Wrtiting Task 1 IELTS The title of population in developed countries and developing countries [6]

The line chart shows the information about the number of population growth between 1800 and 2100. While, the bar chart displays the number of population in developed countries and developing countries from 2015 to 2040. It can be seen that the highest inhabitation of developing countries will rise a peak dramatically in 2040. On the other hand, the developed countries stay constant from 2015 to 2040.

in 1800, the number of people in in the started at 1000 millions of people. The growth of population increased gradually to 3000 millions in 1950. And, it will increase sharply at 8000 millions in 2040. A rapidly decline will happen in the last of year in 2100. Despite, it will reach the same condition in the present.

Ultimately, by continuing a growing of population in developed country. It can be seen that the population of developed countries will occur a like of number around 1000 millions in 2040.


Dayat   
Dec 30, 2016
Writing Feedback / Mothers in Australia over forty years old. Essay Writing task 1 [5]

Hallo, good night hanna, i have some corrections to you about grammatical error

For the first

The correction is
... the number of children who were ever born from women with the age of 40-44 years in ...
All in all, it can clearly be seen clearly that the women did not had baby ...

For the second

The correction is
Furthemore, it was seen clearly that in the end of period, in 2006, females who were born 2 children reached a peak at 38,3%,...

Good job guys
Regards
Dayat   
Dec 30, 2016
Writing Feedback / The prolificity of women in their forties at the antipodes [4]

@Citra07
Hy Citra, good night, i have some corrections from grammatical error of your writing

The first

the correction is
The women in aged 40-44 years who had children in Australia was reported in a table over 25 years since 1981. Overall, the woman who had no child, one child, and two children climbed for the every year. However, the other categories showed decreased percentages.

The second

the correction is
In all of the period, the woman who had two children was the biggest percentages. In 1981, the data shows 29% and in the end of the period, the data showed 38.3% it described the data an increase at 9.3%.

If you say past time, please use tenses of simple past. if you want to chane the word (increas) becoming Noun, you can use the article (an)

Good job guys
Regards
Writing
Editing Help?
Fill in one of the forms below to get professional help with your assignments:

Graduate Writing / Editing:
GraduateWriter form ◳

Best Essay Service:
CustomPapers form ◳

Excellence in Editing:
Rose Editing ◳

AI-Paper Rewriting:
Robot Rewrite ◳