Unanswered [30] | Urgent [0]
  

Posts by ngthuha
Name: Nguyen Thu Ha
Joined: Sep 19, 2020
Last Post: Dec 16, 2020
Threads: 6
Posts: 14  
Likes: 5
From: Viet Nam
School: Ha Noi University

Displayed posts: 20
sort: Oldest first   Latest first  | 
ngthuha   
Sep 19, 2020
Writing Feedback / IELTS Writing Task 1 - Line graph: Radio and TV audiences in UK October - December 1992 [4]

Summarise the information from the graph


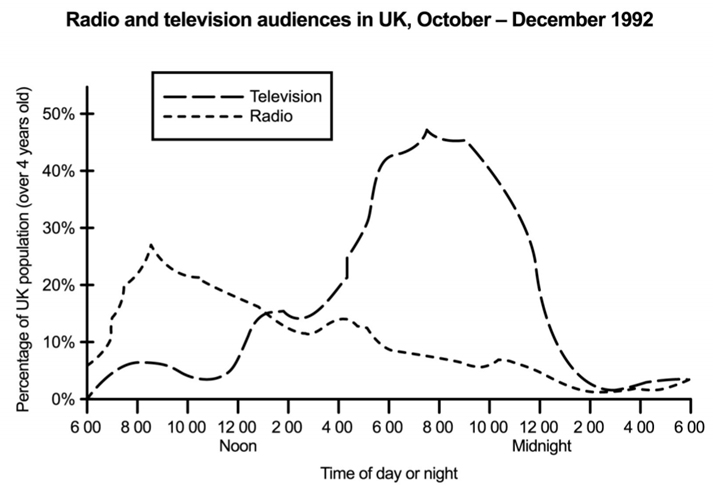
The graph below shows radio and television audiences throughout the day in 1992. Summarise the information by selecting and reporting the main features, and make comparisons where relevant.

The line graph compares the differences on the proportion of British people watching TV and listening to the radio in one day over the last 3 months in 1992.

It is clear that more people prefers radio in the morning while many of them spent the evening watching TV. Also, the number of TV viewers are higher than those listening to the radio over the 24-hour period.

In the morning, around 8% of British population started their morning by listening to the radio but none of them choose to watch TV. Over the next 5 hours, the percentage of radio audiences reached a peak of nearly 30% at 9 a.m. and fall steadily from that time whereas the figures for TV viewers remained below 10%.

From 1 p.m., the number of British watching TV significantly rose to approximately at 45% between 8 p.m. to 9 p.m., over 4 times higher than radio listeners at that time. However, both the proportions of radio and TV audiences remained relatively low under 10% by midnight.


ngthuha   
Sep 22, 2020
Writing Feedback / Three different crimes and the number of cases committed between 1970 and 2005 [4]

Hi nancyliao! I have some feedbacks on your essay and also I hope that we can exchange experience as well as support each other to improve our writing skill.

- In terms of the overall statement paragraph, 2-3 sentences are needed. Besides the upward trend in 3 types of crime, you should point out which line was the highest or lowest for the whole/most of the period. For example: The car theft is by far the most popular types of crime throughout the period.

- For the detail paragraphs, it is important that you should compare the lines and avoid describe the lines separately. Also you can choose some interesting points to compare the figures.

For example: I would choose the period from 1970-1980 , 1980-1995 and 1995-2005. I prefer the point 1980 and 1995 to write as these are the years when house burging and car theft reached their peak.

That's all about my feedbacks!
Have a nice day!
ngthuha   
Sep 22, 2020
Writing Feedback / Keeping 21st century wild animals safe and sound [3]

Hi Aiden Rose! I've read your essay and I'd like to leave some feedbacks
I think you did a good job when you presented the main points as well as specific and practical example to support your opinion. I really like your main point! However, you had some gramatical errors:

- I believe that wild-animal protection should take should be taken the first priority as wild animals plays play an a significant role infor the earth and human life

- But when the number of risks arethe number of risks is taken big enough, it will definitely collapse. Therefore, wild animals influence human beings directly or indirectly

- As we all know, they are punished severeseverely and violently until they are able to do correctly what they are toldhave been told
- ....many diseases have been cured by using parts of animals' bodiesanimal bodies
- To sum up, although wild animals do not seem to effectaffect or have an effect on our daily lives like most of us feel, we should not underestimate the contribution of them
ngthuha   
Sep 23, 2020
Writing Feedback / IELTS Writing Task 1 - Line graph: the figures for passenger railway journeys in the UK [4]

The graph shows the number of passenger railway journeys made in Great Britain between 1950 and 2004/5


The line graph compares the figures for travel by British people using 3 different systems of railway over a period from 1950 to 2004/05.
It is clear that the light rail & metro system is by far the least popular throughout the period shown. Also, while the number of people who used London underground and light rail & metro systems increased, the number of national rail passengers dropped slightly.

In 1950, the national rail network and the London Underground were used by 1000 million and around 700 million people respectively, whereas light rail & metro system remained the least popular choice until the year 1980. The national rail network users reached a peak of nearly 1100 million in 1960 and fell by roughly 400 in the 1980s. During the same period, London underground fell steadily to 500 millions passengers

By 2004/05, a considerably increase in the number of users can be seen for the underground, with a jump of nearly 600 millions and from around 1982. Also, the figures for national railway and metro systems rose considerably to nearly 1000 million and 150 million commuters.


ngthuha   
Sep 24, 2020
Writing Feedback / Essays from Ielts Writing Task 2 [2]

- The example mentioned in the second paragraph is quite confused...the doctors wear the same clothes which they use to go to club instead of scrubs when take part in a surgery... .

- Your essay contains lots of errors in terms of both grammar and word form
e.g: On the flip side, the work cloth did vital did play a vital role in office
According to statistics, in some place that focus on the creation creative and artistic development like marketing companies
Therefore, the effective effectiveness and efficient quality of works go higher.
.
I'm a learner and still trying hard to improve my writing skill, please correct me if I made a mistake.
ngthuha   
Sep 24, 2020
Writing Feedback / IELTS Task 2 - Opinion Essay - Language extinction [4]

There existed a grammatical error in here : Some people do not consider this as a significant loss .... "consider" grammatically isn't followed by "as" such as I consider John my bestfriend.
ngthuha   
Oct 17, 2020
Writing Feedback / IELTS 1: The line graph compares 4 European nations in terms of the average carbon dioxide emissions [3]

Average carbon dioxide emissions per person


The line graph compares 4 European nations in terms of the average carbon dioxide emissions over the period from 1967 to 2007.
It is noticeable that the UK was responsible for the highest level of CO2 emissions. Moreover, a downward trend can be observed in emissions from Sweden throughout the period.

From 1967 to 1977, the amount of CO2 emissions in the UK remained unchanged, at around 11 metric tonnes per person. During the same period, an upward trend can be seen in 3 other countries: Sweden Italy and Portugal, with an increase to about 10.5 tonnes, 6.5 tonnes and 2.5 tonnes respectively.

By 2007, CO2 emissions from Sweden had plummeted to nearly 5.5 metric tonnes, whereas the respective amounts came from Italy and Portugal had considerably risen to 5.5 tonnes and 7.5 tonnes. By contrast, there had been a reduction in the level of CO2 in the UK since 1977, with a gradual decrease of around 2 metric tonnes per person at the end of the period.


ngthuha   
Oct 17, 2020
Writing Feedback / Essay about the causes and solutions of teenagers prefer socializing online to meeting in person [4]

1. Your writing contains 480 words, which is too much for a writing task 2. You probably do not have enough time to write a 480-word essay in 40 minutes.

2. this trend emerges has created/had some detrimental impact on young generation -> To my knowledge, "impact" doesn't go with the verb "emerge"
3. ... make people come up with catch/get some diseases ... -> I reckon that "come up with some diseases" is incorrect as "come up with" means to think of an idea or plan.

4. the government may consider force forcing ... for video call video calling or chatting ... of teens useusing the call
ngthuha   
Oct 19, 2020
Writing Feedback / The percentage of people working in different sectors in town A and B [3]

1. I got quite confused with the second sentence in paragraph 2. I think you should restate it more clearly.
2. You might have some inappropriate word choice. eg: "the hugest" sounds uncommon as "huge" itself is an absolute adjective. Also, "the rate of people" should be changed into "the proportion of people" or :the number of people".

I'm still a learner and my feedback might be incorrect, so please correct me if I'm wrong. Thank you!
ngthuha   
Oct 19, 2020
Writing Feedback / IELTS Writing Task 1 - Rice exports from Thailand and Vietnam [2]

prices per tonne of rice in two countries


The line graphs compare prices of exported rice each month in two Asian countries: Vietnam and Thailand each month from 2012 to 2015.
It is apparent that rice exports from Thai Lan cost higher than that from Vietnam. Moreover, rice prices were higher in 2012 and 2013 than in the later years.

In 2012, rice exports from Thailand were sold at $350 per tonnes in January, over two times the figures for Vietnam. However, after a peak of nearly $400 in February, Thailand rice prices drop minimally and stabilized at $340. Meanwhile, Vietnam rice exports saw a slight increase to $200 at the end of 2012. Throughout 2013, a small rise of roughly $50 was observed in price of Vietnam rice exports, whereas that of Thailand had experienced a plummet of $150 in the first 4 years before fluctuating above $200 over the remaining months.

Looking at 2014, there was a sharp decline from $150 to $100 in the price of Thailand rice exports, while the figures for Vietnam followed an opposite trend, with a small rise of $25 over the year. However, 2015 witnessed an upward trend in both nations, with an increase of $50 per tonnes.


ngthuha   
Oct 20, 2020
Writing Feedback / IELTS 1: The line graph compares 4 European nations in terms of the average carbon dioxide emissions [3]

@Holt I have rewritten my general trend paragraph. Could you check it for me whether it is good or not. Thank you so much!
It is noticeable that the UK was responsible for the highest level of CO2 emissions throughout the period. However, while the British and the Swedish people reduced their emissions, there was an upward trend in CO2 released from Italy and Portugal.
ngthuha   
Oct 22, 2020
Writing Feedback / The chart below illustrates the number of prisoner in five nations throughout 50 years [5]

1.For the summary paragraph, you don't have to include the specific year in sentence, e.g. with the exception of in 1930 and 1950. Just focus on the starting and the ending point for the overall trend. Also this sentence should be with the exception of in of the year or of 1930 and 1950.

2. For the second and the third paragraph, it would be better if you compare the figures, rather than describing each data separately.
3. Since the period ranging from 1930 to 1980, you should write in past tense in describing data
.
These are my opinion for your writing. I'm still a leaner so please correct me if I get wrong
ngthuha   
Dec 14, 2020
Writing Feedback / Student part time jobs while learning at campus [3]

Hi! I would like to have some feedbacks on your writing
1. You could take into consideration element relating to word choice in your essay, such as 'saving habit' should be 'saving plan' or 'reasonable quality of life' would be 'good quality of life' as reasonable does not go together with quality

2. Also there is a minor grammatical error in this sentence 'Although they might struggle to balance work and study balance between work and study,...."
ngthuha   
Dec 14, 2020
Writing Feedback / IELTS Writing Task 1 - Bar chart: Waste collection from 2011 to 2015 [3]

tons of waste collected by a recycling centre


The chart below shows waste collection by a recycling centre from 2011 to 2015. Summarize the information by selecting and reporting the main features and make comparisons where relevant.

The bar charts compare the differences on the amount of waste collected by a recycling center in 4 different items over a 4-year period starting from 2011.

Overall, it is obvious that an upward trend could be observed in 4 types of waste collection. Moreover, Paper was by far the most common waste item throughout the period shown.

In 2011, there were 57 tons of paper recycled in the center, followed by 48, 35 and 32 tons of glasses. tins and gardens, respectively. Over the following 2 years, the amount of paper waste decreased considerably by 37, to 40 tons. By contrast, waste from glass and tins experienced a drop of around 7 tons in 2012, before recovering to 48 and 34 tons a year later, respectively. During the same period, the amount of gardens waste fell significantly by 17 tons, then followed by a nearly double, at 31 tons in 2013.

From 2013 to 2015, a dramatic rise could be seen in the amount of paper waste, with a jump of 30 tons in just 2 years. The figures for 3 remaining types of waste were relatively the same, with a minimal increase of 4 tons of waste. By 2015, 70 tons of paper waste were collected by the center, while the amount of waste collection from glass, tins and gardens were significantly lower, at 52, 39 and 35 tons.


ngthuha   
Dec 16, 2020
Writing Feedback / IELTS 1 - Maps: Various developments which were made to the cinema facilities, from 1980 to 2020 [2]

The diagrams below show changes of a cinema from 1980 until now.


Summarize the information by selecting and reporting the main features, and make comparisons where relevant


The pictures illustrate some changes that were made to a cinema between 1980 and 2020.

It is noticeable that the cinema underwent a significant refurbishment with the introduction of a number of cinemas and amenities in either side.

Looking at the changes in more details, it can be seen that in 1980 there were only 2 cinemas, the first of which located on the immediate left of the entrance and remaining was sited on the opposite side. Over the following 40 years, cinema 2 was relocated on the same side with the first cinema to make room for 3 additional cinemas, which was positioned on the right-hand side of the entrance.

The two maps also show that another major development was made to the facilities, which accommodated various needs of moviegoers. A food and beverage store as well as a relax room were built on the immediate left of the entrance where cinema 1 was once located. Regarding the opposite side, the drink stall at the corner was converted into a DVD shop. Despite considerable changes over 40 years, the toilet and the ticket room have remained unchanged.


Writing
Editing Help?
Fill in one of the forms below to get professional help with your assignments:

Graduate Writing / Editing:
GraduateWriter form ◳

Best Essay Service:
CustomPapers form ◳

Excellence in Editing:
Rose Editing ◳

AI-Paper Rewriting:
Robot Rewrite ◳