thanhtrang
Jun 10, 2021
Writing Feedback / WRITING TASK 1 : The line graph shows the percentage of New Zealand population from 1950 to 2050 [4]
It is clear that the percentage of the age group of both 0-14 and 38-45 witnessed the same trend of increasing, the opposite was true for the figure for the 25-37 and over 65 age group over the period. It is also notable that, the increase of the population 0-14 aged was the most significant.
In 1950 the figure for people 0-14 years old stood at 5% in comparison with over 20% of the 38-45 age group. Over the period of 40 years, the percentage of people aged around 38 and 45 rose dramatically to reach a peak of nearly 50%, which is expected to decrease slightly to just 40% in 2050. In contrast, despite a gradual drop of around 3% during the first 40 years, the figure for 0-14 aged population is predicted to increase sharply to 20% in the last year.
On the other hand, the proportion of people who were in the age between 25 and 37 and over 65 saw a downward trend. Starting at 60% in 1950, the percentage of people age over 65 increased marginally to 70% in 1990. However, in 2050, it is expected to fall substantially to 55% during the last year. Meanwhile, that of 25-37 years old fluctuated around 20% from 1950 to 1990, which is expected to fall to 0% at the end of the period.
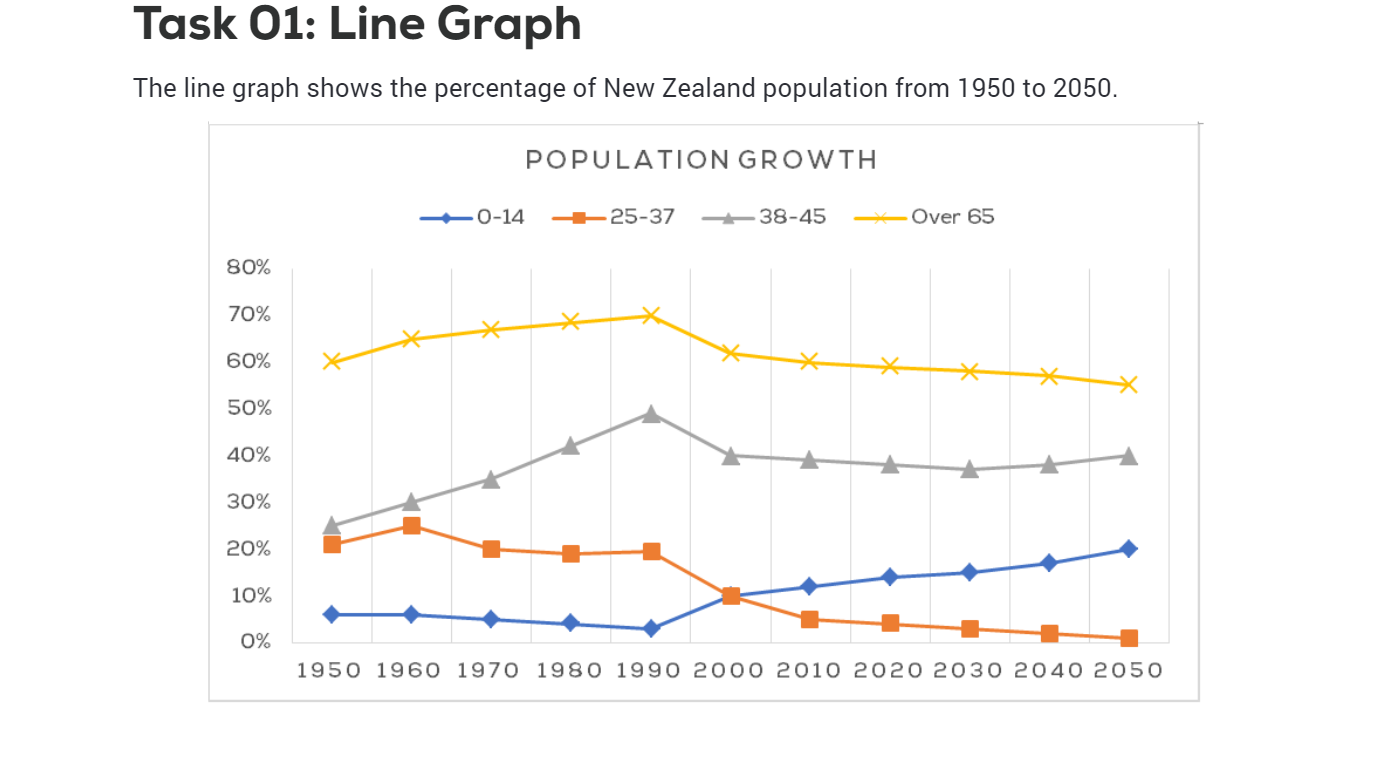
The line chart illustrates the New Zealand population growth pattern between 1950 and 2050.
It is clear that the percentage of the age group of both 0-14 and 38-45 witnessed the same trend of increasing, the opposite was true for the figure for the 25-37 and over 65 age group over the period. It is also notable that, the increase of the population 0-14 aged was the most significant.
In 1950 the figure for people 0-14 years old stood at 5% in comparison with over 20% of the 38-45 age group. Over the period of 40 years, the percentage of people aged around 38 and 45 rose dramatically to reach a peak of nearly 50%, which is expected to decrease slightly to just 40% in 2050. In contrast, despite a gradual drop of around 3% during the first 40 years, the figure for 0-14 aged population is predicted to increase sharply to 20% in the last year.
On the other hand, the proportion of people who were in the age between 25 and 37 and over 65 saw a downward trend. Starting at 60% in 1950, the percentage of people age over 65 increased marginally to 70% in 1990. However, in 2050, it is expected to fall substantially to 55% during the last year. Meanwhile, that of 25-37 years old fluctuated around 20% from 1950 to 1990, which is expected to fall to 0% at the end of the period.