Unanswered [26] | Urgent [0]
  

Home / Writing Feedback   % width Posts: 4


IELTS Writing Task 1 - Bar chart (various flavours of food)


dannydo 1 / 1  
Apr 13, 2013   #1
Hi all,

I am new to this forum. I would like to have your comment on the IELTS writing task 1. Please help. Thank you very much.

--------------------------------------------------

Task 1

You should spend about 20 minutes on this task

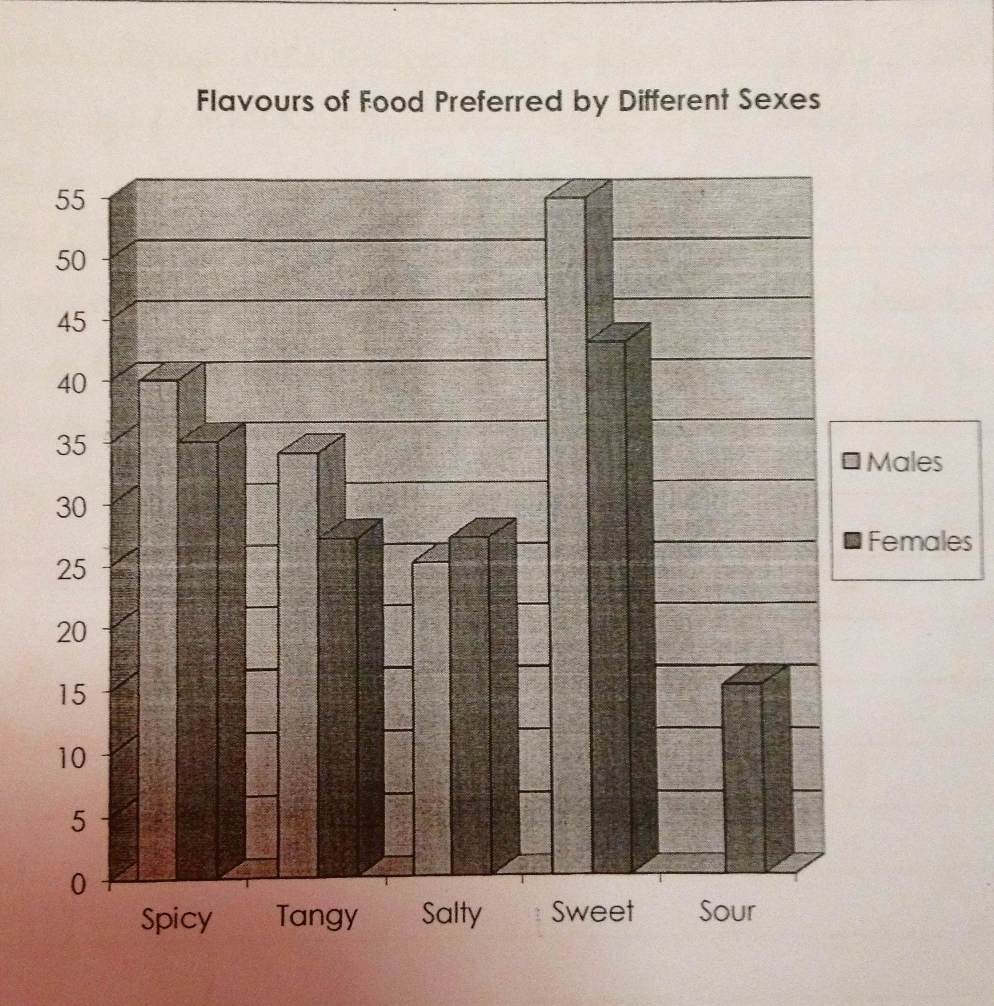
The graph below shows the various flavours of food preferred by different sexes in a month

Summarise the information by selecting and reporting the main features, and make comparisons where relavant.


Answer:

The graph illustrates the difference in the choices of food tastes between males and females in a month.

As can be see from the data, both of sexes are very fond of sweet food. Data reveals that 55 males prefer eating sweet food, while 43 females choose this kind of flavour. However, the number of males who like spicy, tangy and salty food decreases gradually from 40 people to 25 people. It is noticeable that no male chooses sour food which is chosen by 15 females as their favourite flavour.

The trend happens quite similarly to woman, there is a slight drop in the number of females who like spicy and tangy about 10 people. Although the number of woman who like tangy and salty food is the same, there is a significant decline in sour food, only 15 people like it.

In conclusion, it is clear that there are different choices between two sexes in their favourite food tastes. Obviously, spicy, tangy and salty food are more popular in males than females, whereas sour food is chosen by only females.

  • bar chart
dumi 1 / 6,925 1592  
Apr 13, 2013   #2
The graph illustrates the difference in the choices of food tastes between males and females in a month.

... keep it simple and clear;
The graph illustrates the preferences of different flavors of food by males and females in a particular month.

As can be see from the data, both of sexes are very fond of sweet food.

The data shows that sweet is the flavor that is mostly preferred by both genders over other flavors.

Data reveals that 55 males prefer eating sweet food, while 43 females choose this kind of flavour.

... before coming to more detailed descriptions, highlight one or two general trends. Then move to the other para to compare and contrast data with more specific details.

Try this website for help on essay structure for this task;
OP dannydo 1 / 1  
Apr 13, 2013   #3
Hi Dumi,

Thanks for your comment. Just another question. For this particular bar chart, is it OK to use "increase, decline, a slight drop ..." to make comparison amongst different flavours?

For example

1. The number of males who like spicy, tangy and salty food decreases gradually from 40 people to 25 people
2. There is a slight drop in the number of females who like spicy and tangy about 10 people
3. There is a significant decline in sour food
dumi 1 / 6,925 1592  
Apr 13, 2013   #4
That's just fine.... Those are good key words you can use in report writing. In this task try to have the reporting tone in your writing.

The trend happens quite similarly to woman, there is a slight drop in the number of females who like spicy and tangy about 10 people.

...This is not very clear... you better specify in which flavors women too follow the same trend. My suggestion;
The same trend can be observed with female preferences for spicy and tangy flavors.
Keep it simple and that naturally makes your writing interesting ;)


Home / Writing Feedback / IELTS Writing Task 1 - Bar chart (various flavours of food)
Writing
Editing Help?
Fill in one of the forms below to get professional help with your assignments:

Graduate Writing / Editing:
GraduateWriter form ◳

Best Essay Service:
CustomPapers form ◳

Excellence in Editing:
Rose Editing ◳

AI-Paper Rewriting:
Robot Rewrite ◳