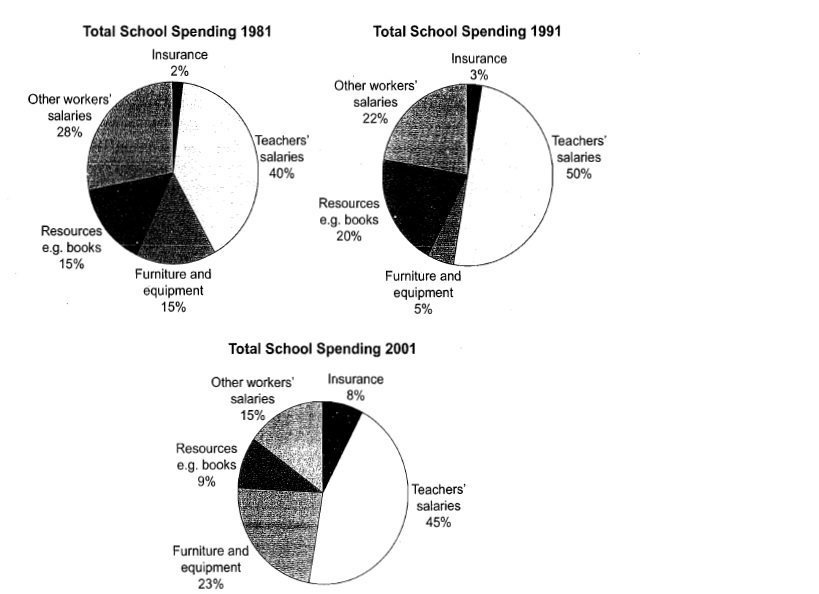
This three pie charts show the changes in annual spending by a particular UK school in 1981,1991, and 2001.A glance at the three given pie graphs reveal some differences among the expenditures at a certain UK school in three different years with 10 years interval starting from 1981 to 2001. As a general trend, the proportion of educators' salaries was accounted for the highest percentage in school expenditures. Meanwhile, school's insurance had the smallest percentage of annual school spending over the times observed.
Looking at the details, the figure of educators' pay check stood at 40 percent in 1981. There was a dropped in the number of school spending by 5 percent in the next ten years. Then, reached a peak at 50 percent in 2001. Other school expenditures for employees' salaries spent 28 percent in 1981. It then rose gradually to 50 percent after one decade but drop to 45 percent in 2001.
Others two aspects shared same trend were resources for school and investment on furniture and equipment. Both graphs showed fluctuation trend and stood at same point which at 15 percent but showed different point in the next two decades. Some resources like books increased rapidly to 20 percent in 1991 then dipped in 2001 at 9 percent. Meanwhile, for investment on furniture and equipment, there was a plunged to 5 percent in 2001. Then, it hit a high point at 23 percent. The last, school insurance, showed upward trend that remained fairly stable over twenty years and enrolment peak in 2001 at 23 percent.

The changes in annual spending by a particular UK school

