Unanswered [30] | Urgent [0]
  

Home / Writing Feedback   % width Posts: 4


In 1990s the land in North America was most affected by over-cultivation factor with 3.3%.


Anna94 47 / 56 3  
Oct 29, 2016   #1
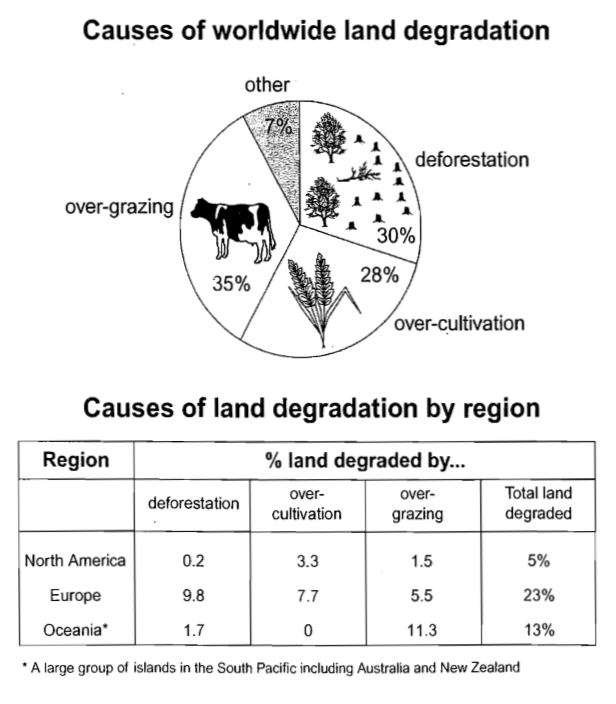
The pie chart shows the main reasons why agricultural land becomes less productive. The table shows how these causes affected three regions of the world during the 1990s

The pie chart provides information about some factors that caused production of agricultural field. The table informs how the regions were influenced by those causes during the 1990s. Overall, over-gazing was the largest factor that caused land degradation, and Europe was the largest region where land degradation had happened.

Over-gazing was the main problem that made land degradation. It stood at 35%. The second factor was deforestation that contributed 30 percent. It had a slight different number with over-cultivation, which the percentage was 28. Other factors were mentioned that had degraded agricultural land.

Land in North America was most affected by over-cultivation factor with 3.3%. Deforestation was the main caused that had affected Europe region in agricultural land by 9.8%. However, the amount case of over-gazing had degraded 11.3 percent land area in Oceania. It carried Oceania as the second larger region that had been degraded in agricultural field than North America with 5%. Nevertheless, Europe got the percentage of land degradation with 23%. 164w

  • Causes of World Wide Land Degradation
badafebriani17 34 / 44 1  
Oct 29, 2016   #2
1. ... some factors that caused production of agricultural field
better you add one of the keywords from the question---> degradation

e.g.: The pie chart provides information about some factors that caused (degradation of) production of agricultural field

2. ... had been degraded (...) North America with 5%.
number more than ten ---> write as picture [1993/ 35/ 1000 etc]
number below ten---> write as a word [four, two]
North America with 5%.--> five percent

good luck
RAY93 35 / 186 136  
Nov 1, 2016   #3
INTRODUCTION

*poorly paraphrased the question [giving incomplete sentence and inappropriate form on another]
*appropriately selected data as overview although poorly wrote it


The table informs how the regions were influenced[the data given is in percentage, so you need to mention the unit of measurement of the data here, in this case in in proportion rate] by those causes ...

... and Europe was the largest region where land degradation had happened.[inappropriate data. It is not about whether the land is the largest or not, it is about the highest percentage]

BODY PARAGRAPH

*tend to make very simple sentences and less accurate complex ones
*although using comparison language in both body paragraphs, still moderate grouping. Indeed, the data given in the different pictures can be compared each other.
*consistent and appropriate tenses chosen according to question timeline
*no major errors in sentence structure despite of the fact that paragraphs written in unvaried style
delvis92 2 / 4  
Nov 1, 2016   #4
hello, i have some suggestions for your writing.

... number with over-cultivation, which the percentage was 28 which had proportion nearly less than a third.

you must not use "percent" continously, youn can innovate as weel as "one in twenty = 5 %" , "50%=a half"


Home / Writing Feedback / In 1990s the land in North America was most affected by over-cultivation factor with 3.3%.
Writing
Editing Help?
Fill in one of the forms below to get professional help with your assignments:

Graduate Writing / Editing:
GraduateWriter form ◳

Best Essay Service:
CustomPapers form ◳

Excellence in Editing:
Rose Editing ◳

AI-Paper Rewriting:
Robot Rewrite ◳