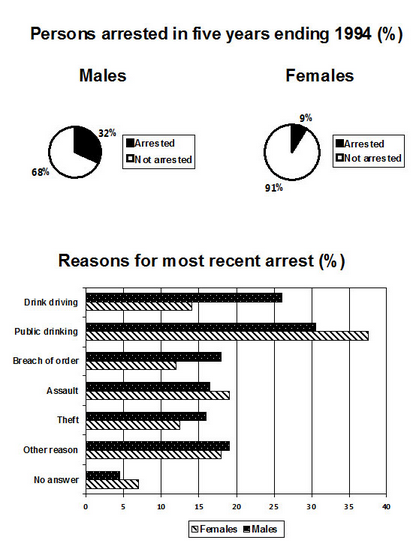
The number of people detained between 1990 and 1991 is revealed in the pie charts, and the rate of motive for most recent detain is displayed in the bar chart. Both were categorised by males and females, and were measured in percent. It is noticeable that the percentage of the males detained was more than the females, and public drinking was motive the highest.
A nearer look at the pie charts presents that the level of the males detained was over three times than the females. The difference between the percentage of the males which was detained and not was by 36%. Next, 83% was the imbalance between the level of females was captured and not.
Public drinking was motive the highest, and both of categories were over of 30% in this motive. Drink driving, breach of order, theft, and other reason were motives which the percentage of the males detained was more than the females. After that, other three clusters were motives which the percentages of the females captured was more than the males.

The number of people detained between 1990 and 1991

