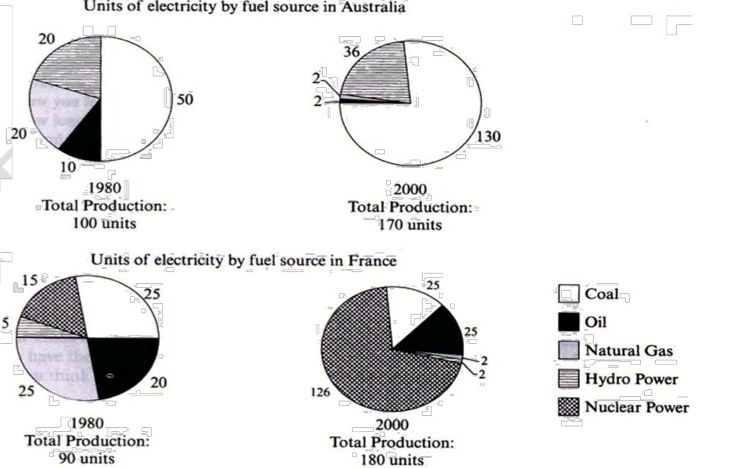
The pie charts below show units of electricity production by fuel source in France and Australia in 1980 and 2020.Write a report describing the information and make comparisons when relevant.
The pie chart compare the number of electricity units provided by 5 types of fuel source in France and Australia in the years 1980 and 2000.
Overall, it can be seen that Australia relied on coal as a primary source of fuel in both years, while France had a balanced use of different fuels in 1980 only to depend heavily on nuclear power 20 years after. Both countries produced remarkably more units of electricity after the period.
In 1980, half of Australia's electricity came from coal, doubling France's figure. Natural gas and hydro power each produced 20 units of electricity, and oil accounted for a small number of 10 units. By 2000, total electricity production went up to 170 units, with a significant portion of 130 units produced from coal. While hydro power was used more than in 1980, oil and natural gas's electricity production dropped to only 2 units each.
On the other hand, France made use of a wider range of fuel source than Australia in 1980. Coal, oil, hydro power and nuclear power all contributed almost equally to electricity production, at around 20 units each, although hydro power was much less utilized compared to australia, producing only 5 units. After 20 years, France experienced a dramatic shift in production, with nuclear power producing 126 out of 180 units total. Coal and oil's yearly production remained relatively unchanged, but both natural gas and hydro power's figure declined to only 2 units of electricity.

Charts

