Unanswered [29] | Urgent [0]
  

Home / Writing Feedback   % width Posts: 2


The pie charts below show units of electricity production from fuel sources in Australia and France


Thao4real 4 / 7  
Nov 18, 2022   #1

electricity from different fuel sources


The pie charts delineate the figures for electricity production from fuel sources in Australia and France, between 1980 and 2000.

In short, coal took the lead for the electricity product in Australia while nuclear power was the main source in France. The amount of electricity by different fuel sources was not similar in both countries.

According to the given pie charts, in Australia, the total electricity production was only 100 units; however, it doubled in the year 2000.There were 50 units and 20 units of electricity produced by coal and hydro power, respectively in 1980. Besides, the oil contributed to only 10 units of electricity. Then, the year 2000 witnessed a considerable increase in the usage of coal which accounted for 130 out of 170 units.

Furthermore, it was shown that electricity production in France was apparent. At the beginning of the period, the dependency on coal denoted as 25 units, followed by a sharp decrease in 2000. In contrast, nuclear power became the primary source, holding 126 units.
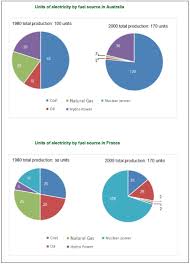


  • Australia
Holt  Educational Consultant - / 14,801 4780  
Nov 20, 2022   #2
The essay is not fully analyzed, discussed, and presented in this reporting essay. The writer has not focused on the proper division of image information in his presentation paragraphs which causes undue confusion for the reader. Since the 3 pairs of images are no properly identified in the summary presentation nor the discussion body, there is no way that the reader will be able to smoothly follow the analysis presented. There is a clear lack of coherence and cohesiveness in the presentations as the image titles are needed as a part of the paragraphs in order to provide clarity in terms of information representation. It is suffice to say that the images were not properly compared and contrasted in this essay and will receive a less than stellar score.


Home / Writing Feedback / The pie charts below show units of electricity production from fuel sources in Australia and France
Writing
Editing Help?
Fill in one of the forms below to get professional help with your assignments:

Graduate Writing / Editing:
GraduateWriter form ◳

Best Essay Service:
CustomPapers form ◳

Excellence in Editing:
Rose Editing ◳

AI-Paper Rewriting:
Robot Rewrite ◳