Unanswered [29] | Urgent [0]
  

Home / Writing Feedback   % width Posts: 4


IELTS Task 1 (Practice) Number of annual visits to Australia by overseas residents


yunana 3 / 6 3  
Jul 7, 2016   #1
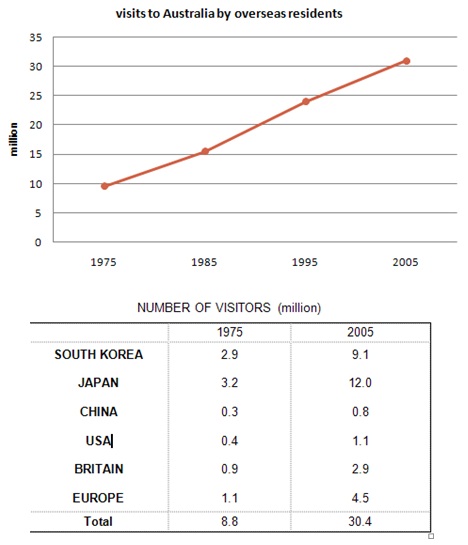
The line graph shows the number of overseas residents in Australia from 1975 to 2005, and the table compares six countries in terms of the number of visitors.

It is clear that the number of visitors rose gradually to about 10 million people in 1975 and 30 million people in 2005.

According to the table, in 1975, visitors of Japan were the most, while that of China were the lowest with 0.3 million people. The second lower country was USA with 0.4 million people. Visitors of other countries visit to Australia with 0.9~2.9 million people.

In 2005, visit to Australia by Japanese reaching with 12 million people, while visitors of China reached mere 0.8 million people. The second lower country was still USA with 1.1 million people. These figures were nearly fourth times as much as those of Europe. Overall, visitors of East countries were much more than those of west countries.

i66.tinypic.com/s4awpc.jpg

  • Graph
Ashkan1363 1 / 6  
Jul 7, 2016   #2
Hi
In 2005, visit to Australia by Japanese reaching with 12 million people :2005 is past but you used present tense.
In 2005,around 12 million people visited Australia.

Overall, visitors of East countries were much more than those of west countries.
.visitor from east countries but still is not make sense

It is clear that the number of visitors rose gradually to about 10 million people in 1975 and 30 million people in 2005

The graph indicates that the number of visitors in 1975 ,about 10 million people,gradually grew to 30 million people in 2005

The line graph shows the number of overseas ...
The line graph shows the number of overseas residents in Australia from 1975 to 2005.The table compares six countries in terms of the number of visitors.

I am not consider my self good writer but I think other people may help you more
ALDI 1 / 2  
Jul 12, 2016   #3
Hy Yunana, this is first time i give contributions in EssayForum :) and i hope my contributions can give strengthen for you.

Firstly, you must be remembering task 1 in the IELTS you need 150 words for completed that descriptions. Your essay was only 148 words. I think if like this, you can get badly score.

Secondly, if you will describe task 1 and that line chart, bar chart, and etc you must know the lowest and highest. Therefore, you can compare them.

That all from me and i believe you can do the best for your IELTS. keep spirit and don't give up.
justivy03 - / 2,366 607  
Jul 21, 2016   #4
Hi Chiang, first of all, I find your analysis very accurate to the graph, it is not only using a very uniform format of explaining the details of the graph but it also depicted the right information related to the provided representation.

What I also notice is the fact that you were able to create the relevance of the graph into the explanation you made in the analysis, I find this review technique to be very good because most of the time, the analysis is only done like a presentation, what or how it should be done is like a story telling, however with strict limitations, the information as well the formality of the analysis should still be observed.

As much as I love how the analysis is done, I would like to point the last couple of sentence in your analysis.

- These figures were nearly fourthfour times as much
- visitors offrom the East countries
- were much more than those of the west countries.

There you have it Chiang, I hope the remarks are still valuable and even more so, useful in your revision as well as for your future writing reference.


Home / Writing Feedback / IELTS Task 1 (Practice) Number of annual visits to Australia by overseas residents
Writing
Editing Help?
Fill in one of the forms below to get professional help with your assignments:

Graduate Writing / Editing:
GraduateWriter form ◳

Best Essay Service:
CustomPapers form ◳

Excellence in Editing:
Rose Editing ◳

AI-Paper Rewriting:
Robot Rewrite ◳