Unanswered [29] | Urgent [0]
  

Home / Writing Feedback   % width Posts: 3


IELTS writting part 1 bar chart practice: Female Unemployment rate in 4 countries of the UK


Linhmely 1 / 2  
Feb 7, 2021   #1

women without job in United Kingdom


The given chart illustrates the percentage of unemployed female in four countries of the UK (England, Wales, Scotland, Northen Ireland) in the 2-year period from 2013 to 2014.

Overall, it could be clearly seen that there are some negligible differences between the statistics of four distinct countries with the England's having the highest rate of female unemployment in 2013. Coming to the next year, 2014, almost all the shown countries's figures have reduced partly, except for Scotland.

To give more details, at the year of 2013,more than 5% of female residents in each country did not have any job available, with the Wales as the least at 5,4% and the England as the most at 6.8%. The Scotland came to the second with 6.1% of female population not being recruited. The Northen Ireland was following next for leaving 5.6% of female population unemployed.

Moving on to 2014, we can observe a recognizable effect of the national governors and the residents themselves in the declination of the female unemployment rate. In England and Wales, the features had been decreased by 3% and 4% respectively compared to the 2013's statistics. The Northen Ireland showed the most aggressive progress with the drop of 1%. In contrast, there was a concerned rise of 0.6% making Scotland the country having the highest female unemployment rate among four given countries in the UK.
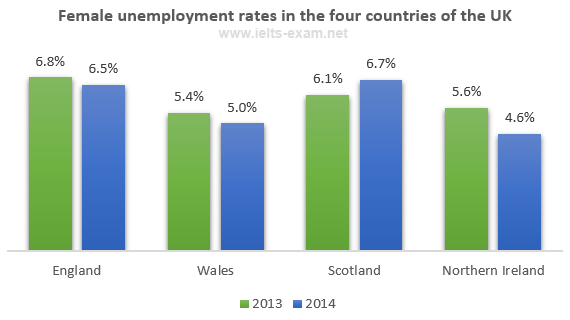

  • The graph shows female unemployment rates in each country of the United Kingdom in 2013 and 2014. S
Holt  Educational Consultant - / 14,801 4780  
Feb 8, 2021   #2
Aim for a clear summary overview. Separate the topic of the chart from the information contained. That means, use one sentence for the topic and separate sentence for the information outline. A third sentence for the coverage year would help make things easier to keep track of on the part of the reader / examiner. Your trending statement should only be a single sentence that does not contain any reference to actual measurements or digits from the image. This is only a summary paragraph. It is not an informative paragraph yet.

You do not need to place "The" before Scotland since you are referring to a proper noun, Scotland being the name of a place or part of the UK monarchy or Commonwealth realm. The same error happened when you referred to Northern Ireland as well. Avoid making the same errors in the future as these will affect your GRA score.

Why are you referring to national governors and residents themselves in the last paragraph? If the information is not included in the image, you should not be including or adding it to the report. This will remove your reliable information and affect your TA score as your report suddenly became unreliable. You are not writing an opinion essay either so giving a personal assessment or opinion of what is causing the measurements to vary in the chart is irrelevant. The inclusion of that information will only serve to lower your score due to task inaccuracy.
Crazy Snake 3 / 5  
Feb 10, 2021   #3
@Linhmely

Your overview: Overall, it could be clearly seen that there are some negligible differences between the statistics of four distinct countries with the England's having the highest rate of female unemployment in 2013.

Imagine you are a reader with no illustration, how could I paint out the trend with the word negligible. It is not specific.


Home / Writing Feedback / IELTS writting part 1 bar chart practice: Female Unemployment rate in 4 countries of the UK
Writing
Editing Help?
Fill in one of the forms below to get professional help with your assignments:

Graduate Writing / Editing:
GraduateWriter form ◳

Best Essay Service:
CustomPapers form ◳

Excellence in Editing:
Rose Editing ◳

AI-Paper Rewriting:
Robot Rewrite ◳