maitouyen10
Feb 14, 2017
Writing Feedback / Task 1 IELTS the bar graph shows the global sales (in bilion of dollars) of different games [6]
Hi ! I am practicing on Ielts and I got this prompt:
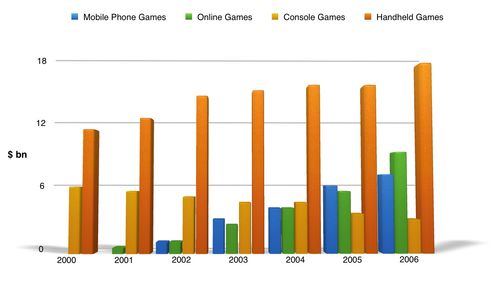
The prompt says : the bar graph shows the global sales (in bilion of dollards) og different types of digital games between 2000 and 2006
The bar graph gives information about worldwide proceeds in dollars of four different kinds of videogames, namely mobile phone, online, console and handled games over the course of 6 years starting from 2000.
It is noticeable that the sales of console games enormously declined over period, whereas the taking of three other things increased dramatically every year.
In 2000, the global proceeds of console games followed by $6 billion, while handled games reached a plateau at $11 billion. Over the next 2 years, sales of console games still plunged by $2bilion although the turnover of handled games still went down . In that year, mobile phone and online began to be known. The next year, the figure for console games decreased by $3bilion.However, sales of three other stuffs.
In 2006, proceeds of handled games hitched the highest point of the graph and turnover of online and mobile games reached &10 and $7bilion .In contrast, sales of console games went down and became the lowest column.
Hi ! I am practicing on Ielts and I got this prompt:
The prompt says : the bar graph shows the global sales (in bilion of dollards) og different types of digital games between 2000 and 2006
sale of games worldwide
The bar graph gives information about worldwide proceeds in dollars of four different kinds of videogames, namely mobile phone, online, console and handled games over the course of 6 years starting from 2000.
It is noticeable that the sales of console games enormously declined over period, whereas the taking of three other things increased dramatically every year.
In 2000, the global proceeds of console games followed by $6 billion, while handled games reached a plateau at $11 billion. Over the next 2 years, sales of console games still plunged by $2bilion although the turnover of handled games still went down . In that year, mobile phone and online began to be known. The next year, the figure for console games decreased by $3bilion.However, sales of three other stuffs.
In 2006, proceeds of handled games hitched the highest point of the graph and turnover of online and mobile games reached &10 and $7bilion .In contrast, sales of console games went down and became the lowest column.

