giahuy141
Apr 3, 2017
Writing Feedback / Energy Production Chart In America [4]
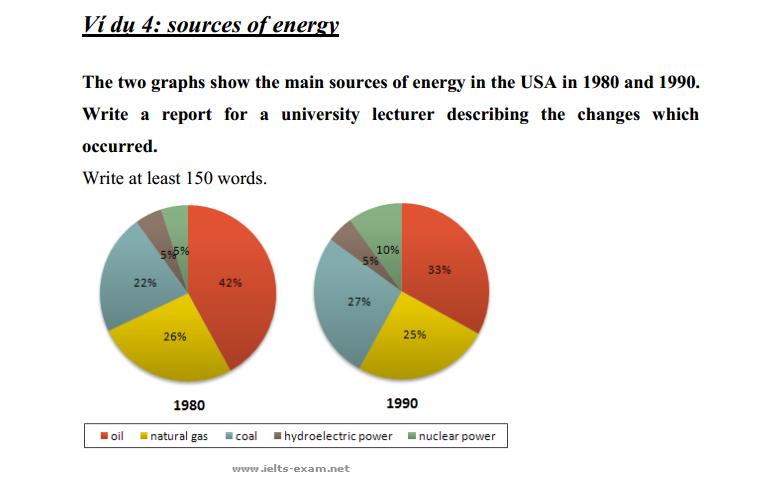
The charts provide information about the amount of energy produced by five important sources in America over the course of 10 years, beginning in 1980.
Looking at the charts, it is immediately obvious that there was relatively little change in the proportions of the other fuels used to generate energy from 1980 to 1990, except for hydro. It is also noticed that Coal was the main source in both years.
In 1980, 42% of energy production came from oil and the figure decreased to 25% in ten years latter. By contrast, the proportion of natural gas used as a source for manufacturing energy, which remained almost stable at 26% in 1980, with 25% in 1990. However, coal experienced a slight decrease from 22% in 1980 to 27% in 1990, which overtook the rate of natural gas.
On the other hand, the amount of hydroelectric power remained constantly at 5% of the total in both years, which was its lowest point during the whole pie charts. Finally, in 1990, the nuclear power went up by 5% from the 1980 figure of 5%.
the amount of energy produced in the usa
The charts provide information about the amount of energy produced by five important sources in America over the course of 10 years, beginning in 1980.
Looking at the charts, it is immediately obvious that there was relatively little change in the proportions of the other fuels used to generate energy from 1980 to 1990, except for hydro. It is also noticed that Coal was the main source in both years.
In 1980, 42% of energy production came from oil and the figure decreased to 25% in ten years latter. By contrast, the proportion of natural gas used as a source for manufacturing energy, which remained almost stable at 26% in 1980, with 25% in 1990. However, coal experienced a slight decrease from 22% in 1980 to 27% in 1990, which overtook the rate of natural gas.
On the other hand, the amount of hydroelectric power remained constantly at 5% of the total in both years, which was its lowest point during the whole pie charts. Finally, in 1990, the nuclear power went up by 5% from the 1980 figure of 5%.

Capture.PNG
