vuthanhhoa
Oct 11, 2017
Writing Feedback / Topic: The graph below shows the differences in wheat exports over three different areas. [2]
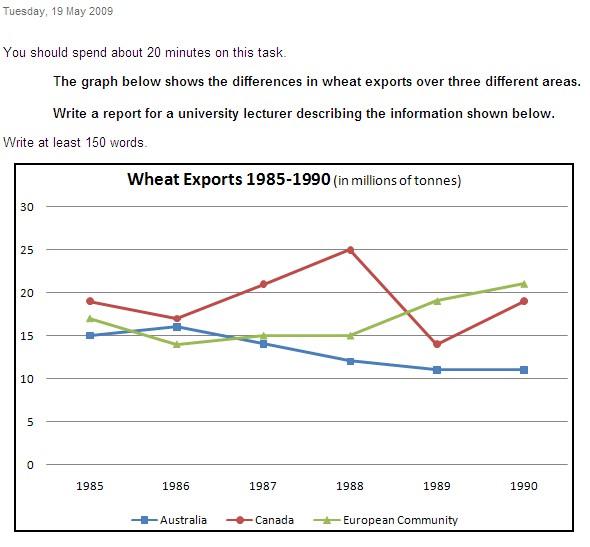
The graph compares the amount of wheat exported by Australia, Canada and European Community from 1885 to 1990.
Overall, it can be seen that there was a fluctuation in the number by all three areas. However, after the middle of 1988, European Community overtook the others as the largest wheat exports.
Turning to details, in 1985, 15 million tons is exported on wheat by Australia, which is the lowest amount in all areas. Regarding Canada and European Community, the figure were little similar, at about 17 million tons and 19 million tons, respectively. Despite some fluctuations, Canada's wheat exports continued to be higher than by others through three years. By 1986, it started to rise significantly and reached a peak at 25 million tons in 1988 while the figure for Australia and the other were only at over 12 million tons and 15 million tons respectively.
After that, there was a dramatic change that the total number of wheat exported by Canada rapidly decreased and dropped to its lowest point in 1989, at under 15 million tons before increasing again. As for Australia, there was a similar trend when the figure continued to go down to around 11 million tons and remained at this point until 1990. In contrast, European Community's exports experienced a gradual increase and reached the highest point at over 20 million tons in 1990.
wheat exports 1985-1990
The graph compares the amount of wheat exported by Australia, Canada and European Community from 1885 to 1990.
Overall, it can be seen that there was a fluctuation in the number by all three areas. However, after the middle of 1988, European Community overtook the others as the largest wheat exports.
Turning to details, in 1985, 15 million tons is exported on wheat by Australia, which is the lowest amount in all areas. Regarding Canada and European Community, the figure were little similar, at about 17 million tons and 19 million tons, respectively. Despite some fluctuations, Canada's wheat exports continued to be higher than by others through three years. By 1986, it started to rise significantly and reached a peak at 25 million tons in 1988 while the figure for Australia and the other were only at over 12 million tons and 15 million tons respectively.
After that, there was a dramatic change that the total number of wheat exported by Canada rapidly decreased and dropped to its lowest point in 1989, at under 15 million tons before increasing again. As for Australia, there was a similar trend when the figure continued to go down to around 11 million tons and remained at this point until 1990. In contrast, European Community's exports experienced a gradual increase and reached the highest point at over 20 million tons in 1990.

IELTSWritingTask1.jpg
