Mai Tran 1201
Jul 13, 2018
Writing Feedback / [Ielts task 1] 2 line graphs about expense on children's sport and the number of participants [3]
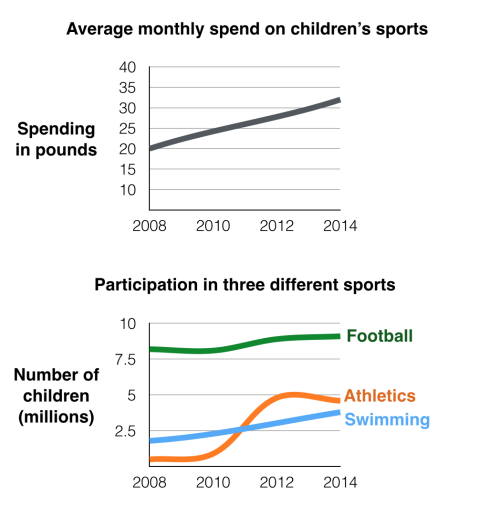
The first chart below gives information about the money spent by British parents on their children's sports between 2008 and 2014. The second chart shows the number of children who participated in three sports in Britain over the same time period.
The first chart illustrates the expense on British children's sport from 2008 to 2014. The second graph compares the number of children taking part in football, athletics and swimming in Britain during the same timescale.
Overall, the money spent on children's sports experienced an increase between 2008 and 2014. It is also clear that football remained to be the most popular sport among Britain children during the same time.
In 2008, British parents spent 20 pounds per month on their children's sport. Since then, this amount of money increased by 5 pounds every two years, with 25 pounds in 2010 and 30 pounds in 2012. This figure then peaked at 32 pounds at the final year of the period
As can be seen from the second graph, the highest number of junior participants in sports was recorded in football. It stood approximately at 8.5 million in 2008 and rose to 9 in 2014. While swimming was second to football in terms of attendances in 2008 with 2.3 million participants, its figure was then overtaken by that of athletics in 2011. During a six-year period starting from 2008, athletics surged and reached 4.9 million in 2014.
I'm preparing for an IELTS test and this is my writing. I hope the contributor can give me some feedback and advice on improvement, and a suggested band score if possible

t1.png