nchi0987
Jan 1, 2019
Writing Feedback / Percentage of monthly household income spent on various items [IELTS -Pie chart 186words] [2]
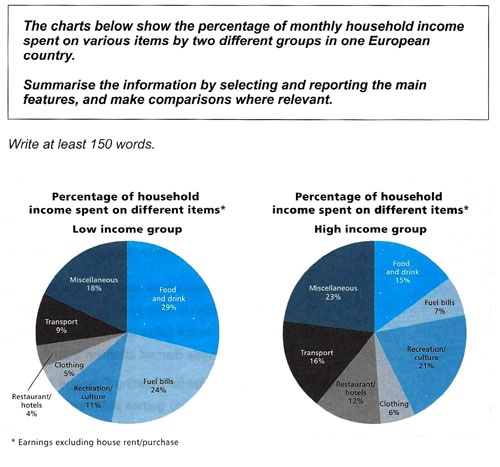
The charts illustrate how low and high income groups spend their disposable income (earnings excluding house rent or purchase) on seven items in an undetermined nation in Europe.
Overall, people in low income group spend the most on two main categories, which are food/ drink and fuel bills. However, the largest expenditure in high income group is on miscellaneous, and both groups share the relative same numbers in restaurant and hotel.
Regarding the low income group, the largest amount of money is spent on food and drink, with 29%, compared to just 15% of the high income group. Low income people pay for fuel bills over threefold than high earners for that, at 24% for the former. Meanwhile, the two groups spend on clothes nearly the same.
By contrast, high income group has the most significant outlay for miscellaneous, 23%. This group also show more interest in transport and recreation/culture, which approximately doubled that of low income group, 16% and 21% respectively. While restaurant and hotels group make up 12% of high income group, it just comprises the least number of low income group, only 4%.
I appreciate any help. Thank you in advance!
How high-income and low-income people spend their money
The charts illustrate how low and high income groups spend their disposable income (earnings excluding house rent or purchase) on seven items in an undetermined nation in Europe.
Overall, people in low income group spend the most on two main categories, which are food/ drink and fuel bills. However, the largest expenditure in high income group is on miscellaneous, and both groups share the relative same numbers in restaurant and hotel.
Regarding the low income group, the largest amount of money is spent on food and drink, with 29%, compared to just 15% of the high income group. Low income people pay for fuel bills over threefold than high earners for that, at 24% for the former. Meanwhile, the two groups spend on clothes nearly the same.
By contrast, high income group has the most significant outlay for miscellaneous, 23%. This group also show more interest in transport and recreation/culture, which approximately doubled that of low income group, 16% and 21% respectively. While restaurant and hotels group make up 12% of high income group, it just comprises the least number of low income group, only 4%.
I appreciate any help. Thank you in advance!

Image
