buihieu2705
Jul 18, 2019
Writing Feedback / Ielts Task 1: The graph illustrates the amount of money spent on research by US government [4]
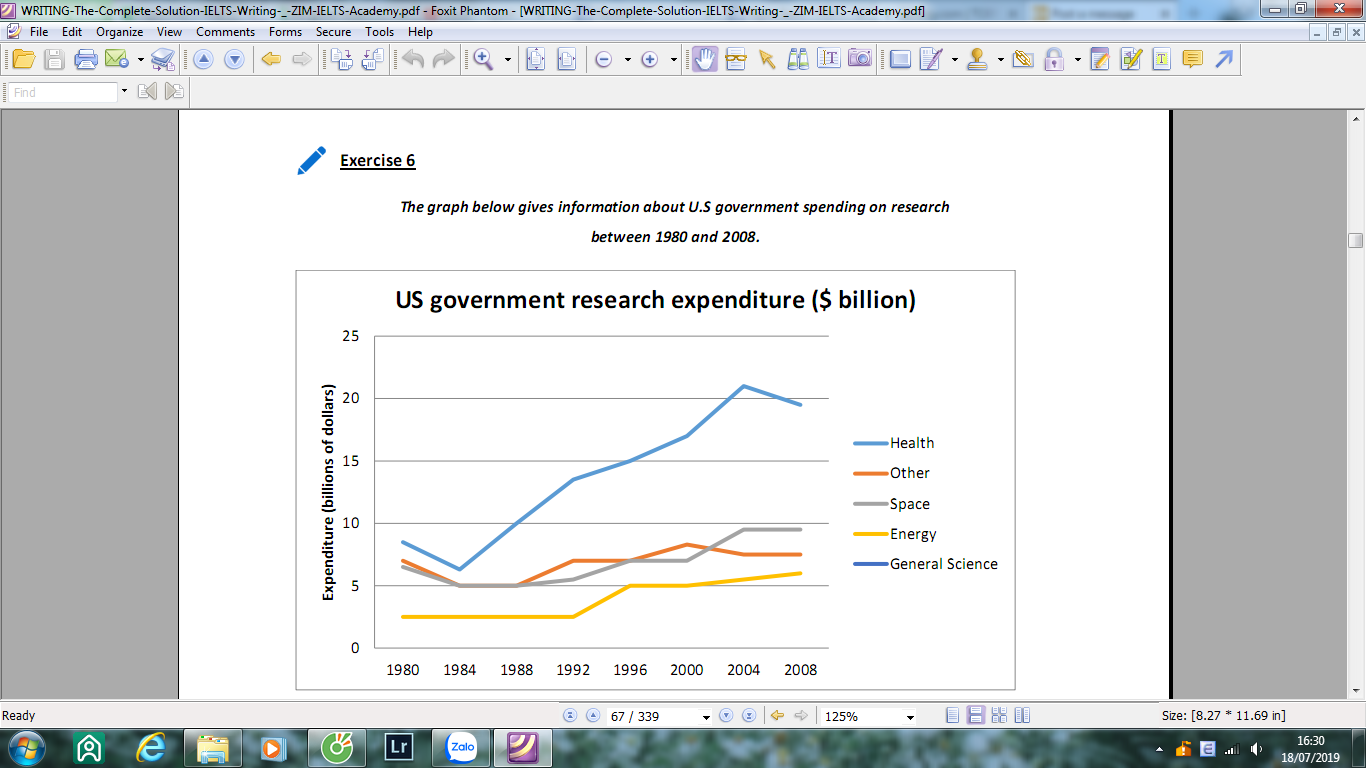
The graph illustrates the amount of money spent on research of us government over the period of 28 years, starting from 1980 .
It is clear that us government expenditure for all researches increased. Also, health was by far the most popular research in this period.
As can be seen from the graph, in 1980, the amount of money poured into health research was approximately 8 billions, more than other researches. In the next 24 years, despite a considerable decrease to about 7 billions in the first 4 years, this figure for health witnessed a dramatical increase to over 20 billions in 2004 before slight decreased to under 20 billions at the end of the period. Meanwhile, the expenditure for energy till remained unchanged in the first 12 years before having a significant increase to just over 5 billions in 2008.
Of other researches, the expenditure for space and other was nearly the same in 1980. over the period of 28 years, these two researches all have fluctuation before ending at nearly 10 billions and 7 billions in 2008 respectively.
US government research expenditure
The graph illustrates the amount of money spent on research of us government over the period of 28 years, starting from 1980 .
It is clear that us government expenditure for all researches increased. Also, health was by far the most popular research in this period.
As can be seen from the graph, in 1980, the amount of money poured into health research was approximately 8 billions, more than other researches. In the next 24 years, despite a considerable decrease to about 7 billions in the first 4 years, this figure for health witnessed a dramatical increase to over 20 billions in 2004 before slight decreased to under 20 billions at the end of the period. Meanwhile, the expenditure for energy till remained unchanged in the first 12 years before having a significant increase to just over 5 billions in 2008.
Of other researches, the expenditure for space and other was nearly the same in 1980. over the period of 28 years, these two researches all have fluctuation before ending at nearly 10 billions and 7 billions in 2008 respectively.

task1.1.png
