vanmaianh
Oct 1, 2019
Writing Feedback / The proportion of people in Australia who did physical exercises frequently [3]
Please help me to check about vocabularies,grammar,and sentence structures in this essay,thank you so much
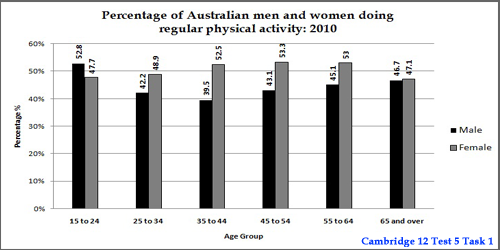
The bar chart reveals the information on the proportion of two gender: male and female in different age groups who did physical exercise frequently in Australia in the year 2010. Units are measured in percent (%)
From an overall perspective, one of the most outstanding features is that there was a significant difference in the rate between men and women in different age groups. In terms of male, the percentage given for the age 15-24 group appeared to be by far the highest one, with 52.8%. On the other hand, the aged 35-44 seemed to be the group of men having the lowest rate, with 39.5%. At the same time, all the remaining rates witnessed between 42.2% and 46.7%.
It is interesting to note that the highest percentage of age groups in terms of female was determined to be the aged 45-54, with 53.3%. Remarkably, the rate of the age 65+ group recorded the lowest rate of women in the year 2010. The other age groups ranged from 47.7% to 53%.
(187 words)
regular physical activity in 2010 Australia
Please help me to check about vocabularies,grammar,and sentence structures in this essay,thank you so much
The bar chart reveals the information on the proportion of two gender: male and female in different age groups who did physical exercise frequently in Australia in the year 2010. Units are measured in percent (%)
From an overall perspective, one of the most outstanding features is that there was a significant difference in the rate between men and women in different age groups. In terms of male, the percentage given for the age 15-24 group appeared to be by far the highest one, with 52.8%. On the other hand, the aged 35-44 seemed to be the group of men having the lowest rate, with 39.5%. At the same time, all the remaining rates witnessed between 42.2% and 46.7%.
It is interesting to note that the highest percentage of age groups in terms of female was determined to be the aged 45-54, with 53.3%. Remarkably, the rate of the age 65+ group recorded the lowest rate of women in the year 2010. The other age groups ranged from 47.7% to 53%.
(187 words)

Cam12t5task1pic.p.png
