tom726
Jul 29, 2020
Writing Feedback / IETLS Task 1 - The graph includes the proportion of households owned and rented in England and Wales [4]
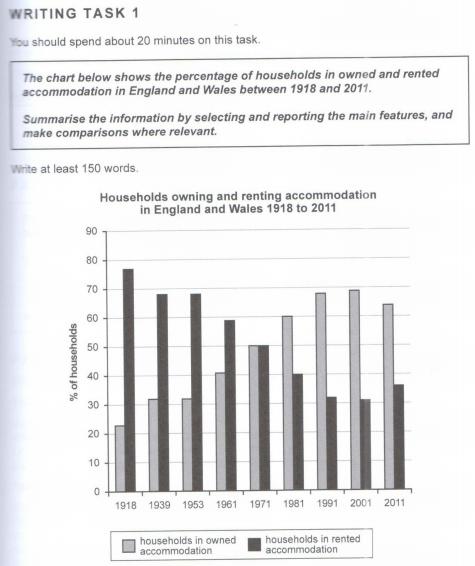
The graph below includes the proportion of households owned and rented in two countries from 1918 to 2011.
The households owned are in a trend of rising while the households in rented are in a falling trend. Their peak and lowest point are in the opposite position.
In 1918, the households owned is about 20% and the households in rented are about 80% respectively. But in 1971, both of them increase and decrease in a similar percentage, lead to an equal level of 50%. In 2011, they kept their trend as a result of 65% and 35%.
Regarding the peak and the lowest point, in terms of owned, its peak is in 2001 which is about 70% while its lowest point is in 1918 which is slightly above 20%. On the other hand, households in rented reached its peak in 1918 with 78% and facing its lowest point in 2001 with slightly over 30%.
Households owning and renting accommodation in two countries
The graph below includes the proportion of households owned and rented in two countries from 1918 to 2011.
The households owned are in a trend of rising while the households in rented are in a falling trend. Their peak and lowest point are in the opposite position.
In 1918, the households owned is about 20% and the households in rented are about 80% respectively. But in 1971, both of them increase and decrease in a similar percentage, lead to an equal level of 50%. In 2011, they kept their trend as a result of 65% and 35%.
Regarding the peak and the lowest point, in terms of owned, its peak is in 2001 which is about 70% while its lowest point is in 1918 which is slightly above 20%. On the other hand, households in rented reached its peak in 1918 with 78% and facing its lowest point in 2001 with slightly over 30%.

Question
