FU YU WEI
Aug 12, 2020
Writing Feedback / IELTS Writing task 1 - Line graph and table about water use worldwide and water consumption [3]
Hi all. It's my first time posting an essay here. Please give me some advice about organization and help me fix this essay, thanks!!!
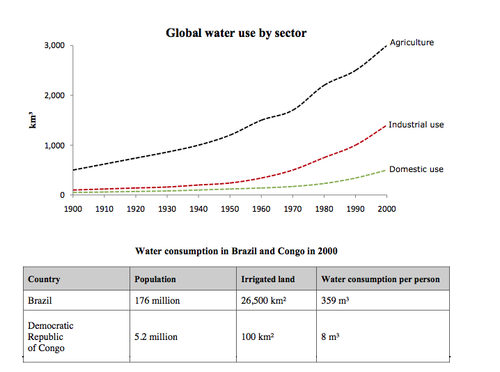
The graph and table below give information about water use worldwide and water consumption in two different countries.
My answer:
The line graph and table compare the amount of water used for agriculture, industry and homes around the world, and water consumption in Brazil and Congo in 2000.
It is clear that global water use rose significantly from 1900 to 2000, and agriculture need the most water to keep it working. We can also see that water consumption in Brazil was more higher than Congo.
In 1900, around 500 km3 water was used by agricultire, and industrial and domestic use stood around one fifith of that amount. By 2000, global water used for argriculture had risen significantly to around 3000 km3, and industrial and domestic water use had also increased to around 1100km3 and 500km3 respectively.
According to the table, the population of Brazil was 176 million whitch is higher than the population of Congo, at only 5.2million. Water consumption per person in Brazil and Congo is 359m3 and 8m3 respectively, and it can explain that the irrrigated land in Brazil is 265 times bigger (as big as) than the irrigated land in Congo.
(174 words)
Hi all. It's my first time posting an essay here. Please give me some advice about organization and help me fix this essay, thanks!!!
Global water use by sector
The graph and table below give information about water use worldwide and water consumption in two different countries.
My answer:
The line graph and table compare the amount of water used for agriculture, industry and homes around the world, and water consumption in Brazil and Congo in 2000.
It is clear that global water use rose significantly from 1900 to 2000, and agriculture need the most water to keep it working. We can also see that water consumption in Brazil was more higher than Congo.
In 1900, around 500 km3 water was used by agricultire, and industrial and domestic use stood around one fifith of that amount. By 2000, global water used for argriculture had risen significantly to around 3000 km3, and industrial and domestic water use had also increased to around 1100km3 and 500km3 respectively.
According to the table, the population of Brazil was 176 million whitch is higher than the population of Congo, at only 5.2million. Water consumption per person in Brazil and Congo is 359m3 and 8m3 respectively, and it can explain that the irrrigated land in Brazil is 265 times bigger (as big as) than the irrigated land in Congo.
(174 words)

GetImage1.png
