hoan
Jul 25, 2021
Writing Feedback / The graph below shows information about US government spending on research between 1980 and 2008 [2]
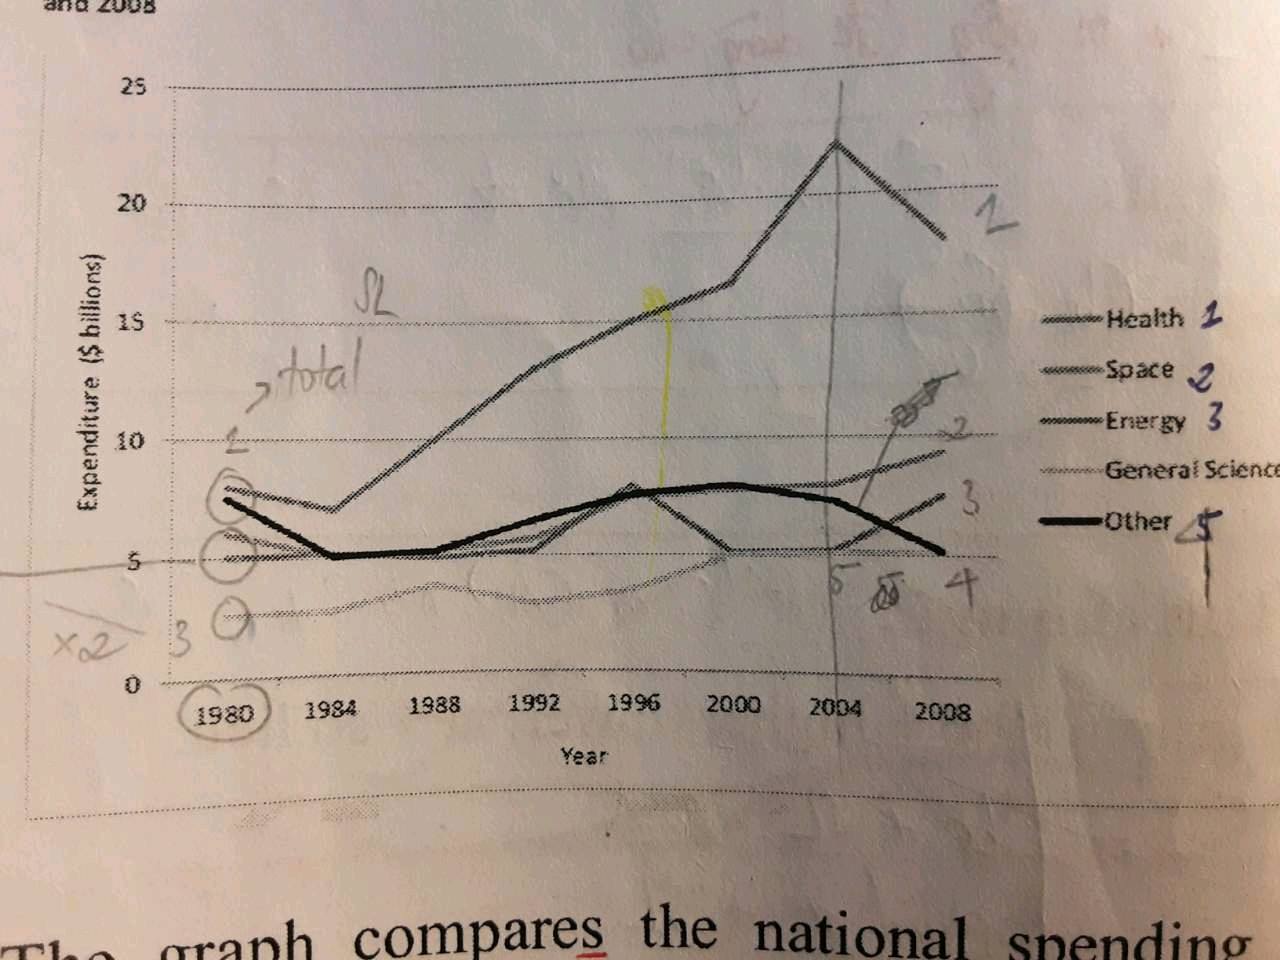
The line graph depicts the amount of national expenditure which was spent on five different categories/sectors of research in the US from 1980 to 2008.
Overall, it is clear that the US national spending on all sectors of research increased over the period given, except for Other. Whereas the US Government used their money more on Health research, General Science was spent the least.
Looking at the details, in 1980, the US expenditure on both Health and Other researches were around 8 billion dollars, while the figure for Space, Energy and General science was lower, approximately 6,5, and 3 billion dollars respectively. During the next 24 years, whereas the amount of spending on Health increased considerably, peaking at about $22 billion, that of other categories fluctuated from roughly 3 to 7 billion dollars throughout this period.
In 2008, Health research witnessed a decrease in spending allocated, declining to about $17 billion. A similar trend was seen in the expenditure for Other research, with a decrease of around $5 billion. By contrast, the figure for Space and Energy rose to about 8 and 5 billion dollars respectively and there was no change at that of General Science, remaining at 5 billion dollars.
research expenditure in the us
The line graph depicts the amount of national expenditure which was spent on five different categories/sectors of research in the US from 1980 to 2008.
Overall, it is clear that the US national spending on all sectors of research increased over the period given, except for Other. Whereas the US Government used their money more on Health research, General Science was spent the least.
Looking at the details, in 1980, the US expenditure on both Health and Other researches were around 8 billion dollars, while the figure for Space, Energy and General science was lower, approximately 6,5, and 3 billion dollars respectively. During the next 24 years, whereas the amount of spending on Health increased considerably, peaking at about $22 billion, that of other categories fluctuated from roughly 3 to 7 billion dollars throughout this period.
In 2008, Health research witnessed a decrease in spending allocated, declining to about $17 billion. A similar trend was seen in the expenditure for Other research, with a decrease of around $5 billion. By contrast, the figure for Space and Energy rose to about 8 and 5 billion dollars respectively and there was no change at that of General Science, remaining at 5 billion dollars.

219976511_8827055423.jpg
