jadon
Aug 4, 2021
Writing Feedback / Wheat Exports from 1985 to 1990 (in million tonnes) [2]
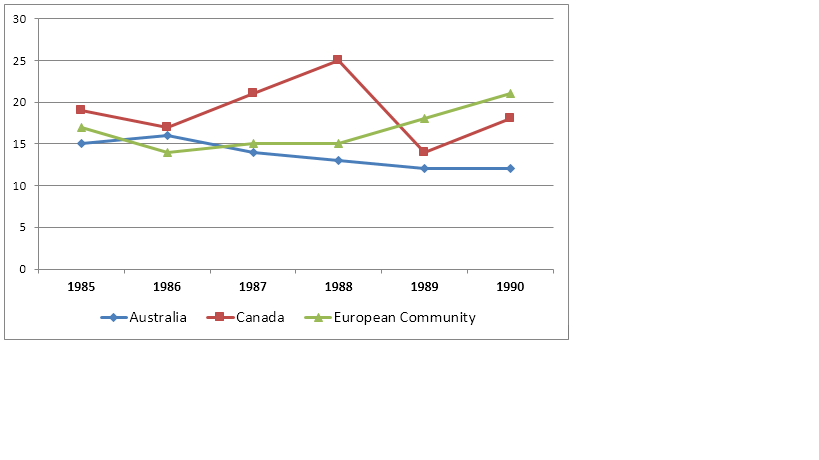
The line graph illustrates how many tones of wheat were exported in five years of Australia, Canada, and the European Community.
Overall, there was an upward trend in the amount of wheat that Canada and The European Community exported. On the other hand, a downward trend was the main point worth noticing in Australia.
In the first three years, the tones of Canadian wheat declined slightly from nearly 20 million to more than 15 million and go up gradually to over 21 million tonnes right after one year. It seems like The European Community had the most stable exportation when it just fell steadily for a little in 1986 then had a minimal increase in 1987, 15 million tonnes. Australia had a little rose between 1985 and 1986 but fell one year later to almost 15 million tonnes.
As the graph shows in last 2 years, Canada reached the peak of 25 million tonnes in 1988 then dropped sharply to less than 15 million tonnes in 1989 got recovery a couple of million tonnes in the next year. After the increase, the tone of wheat that The European Community exported had kept instant at 15 million between 1987 and 1989 before rose again and peaked at 20 million in the last two years. Australia continues to go down slowly and hit the lowest number from 1988 to 1990.
The graph - wheat exports
The line graph illustrates how many tones of wheat were exported in five years of Australia, Canada, and the European Community.
Overall, there was an upward trend in the amount of wheat that Canada and The European Community exported. On the other hand, a downward trend was the main point worth noticing in Australia.
In the first three years, the tones of Canadian wheat declined slightly from nearly 20 million to more than 15 million and go up gradually to over 21 million tonnes right after one year. It seems like The European Community had the most stable exportation when it just fell steadily for a little in 1986 then had a minimal increase in 1987, 15 million tonnes. Australia had a little rose between 1985 and 1986 but fell one year later to almost 15 million tonnes.
As the graph shows in last 2 years, Canada reached the peak of 25 million tonnes in 1988 then dropped sharply to less than 15 million tonnes in 1989 got recovery a couple of million tonnes in the next year. After the increase, the tone of wheat that The European Community exported had kept instant at 15 million between 1987 and 1989 before rose again and peaked at 20 million in the last two years. Australia continues to go down slowly and hit the lowest number from 1988 to 1990.

Untitled.png
