thanhyen2003
Mar 8, 2022
Writing Feedback / IELTS WRITING TASK 1: HELP ME TO CHECK MY PREPARATION FOR MY UPCOMING EXAM - export values [3]
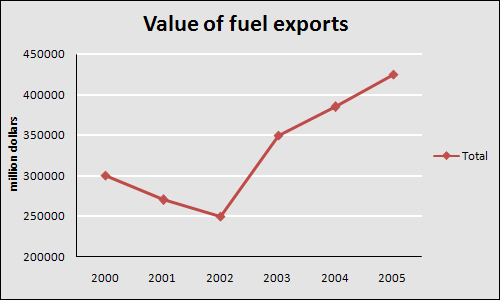
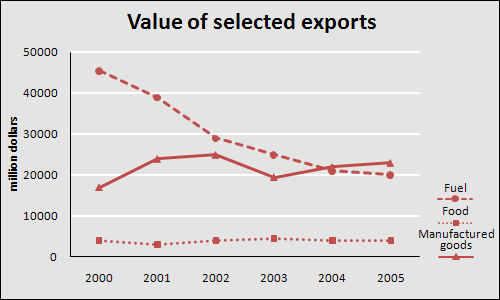
The graph below shows the total value of exports and the value of fuel, food and manufactured goods exported by one country from 2000 to 2005.
Summarise the information by selecting and reporting the main features, and make comparisons where relevant.
The charts demonstrate the value of products exported, especially in fuel, food, manufactured goods of one country during the 5-year period from 2000 to 2005.
The price of goods exported from this country increased in general but particularly, these figures decreased by 50000 dollars between the year 2000 and 2002 and began to rise sharply 4 years later which nearly tripled in the final year than that in the initial year.
The value of export was not the same between different kinds of goods within one country. It is clear to see from the charts that there were three trends of exported value corresponding to fuel, food and manufactured goods. Firstly, food had the least contribution in the total value export which remained stable at 5000 dollars level during 6 years. Secondly, the profit earned from selling fuel to others of this country made up the highest figure in 2000 but these declined gradually through 2000 to 2005. For manufactured goods, this data fluctuated between 2000 and 2005 from nearly 16000 dollars to approximately 25000 dollars.
PLEASE HELP ME. THANK YOU VERY MUCH
the value of fuel and other goods exported
The graph below shows the total value of exports and the value of fuel, food and manufactured goods exported by one country from 2000 to 2005.
Summarise the information by selecting and reporting the main features, and make comparisons where relevant.
The charts demonstrate the value of products exported, especially in fuel, food, manufactured goods of one country during the 5-year period from 2000 to 2005.
The price of goods exported from this country increased in general but particularly, these figures decreased by 50000 dollars between the year 2000 and 2002 and began to rise sharply 4 years later which nearly tripled in the final year than that in the initial year.
The value of export was not the same between different kinds of goods within one country. It is clear to see from the charts that there were three trends of exported value corresponding to fuel, food and manufactured goods. Firstly, food had the least contribution in the total value export which remained stable at 5000 dollars level during 6 years. Secondly, the profit earned from selling fuel to others of this country made up the highest figure in 2000 but these declined gradually through 2000 to 2005. For manufactured goods, this data fluctuated between 2000 and 2005 from nearly 16000 dollars to approximately 25000 dollars.
PLEASE HELP ME. THANK YOU VERY MUCH

1.gif
2.gif
