Harry26
Sep 2, 2022
Writing Feedback / The chart illustrates consumption of three kinds of fast food by teenagers in Mauritius from 1985 to [2]
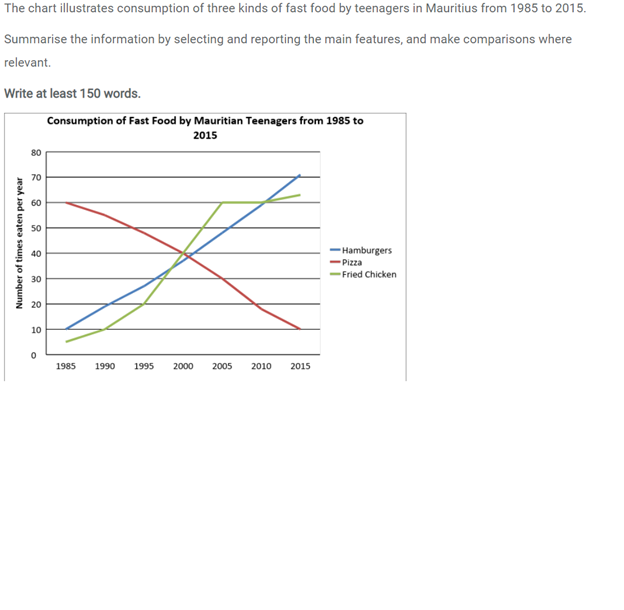
The graph compares the consumption of 3 categories of fast food, namely hamburgers, pizza and fried chicken by teenagers in Mauritius over the course of 30 years, starting in 1985.
Overall, it is clear that the amount of fast food consumed experienced an upward trend with the exception of Pizza which declined significantly. However, this type of food registered the highest figure in the first year of the 30-year period.
Looking at the graph more closely, one can see that in 1985, hamburgers were consumed 10 million times, while pizza and fried chicken were consumed 60 million times and about 5 million times respectively. Over the following 25 years, the consumption of fried chicken and hamburgers rose to 60 million times, but the figure for pizza fell steeply by around 40 million times.
From 2005 to 2015, the consumption of hamburgers increased steadily by about 20 million times, and fried chicken consumption stayed at 60 million times in the first five years of this period, before rising slightly between 2010 and 2015. By contrast, pizza saw a decline in consumption of approximately 20 million times over the same 10-year period. By 2015, pizza consumption had dropped 10 million times, while the respective times that fried chicken and hamburgers are consumed had risen to about 62 million times and 70 million times.
fast food consumption by mauritian teens
The graph compares the consumption of 3 categories of fast food, namely hamburgers, pizza and fried chicken by teenagers in Mauritius over the course of 30 years, starting in 1985.
Overall, it is clear that the amount of fast food consumed experienced an upward trend with the exception of Pizza which declined significantly. However, this type of food registered the highest figure in the first year of the 30-year period.
Looking at the graph more closely, one can see that in 1985, hamburgers were consumed 10 million times, while pizza and fried chicken were consumed 60 million times and about 5 million times respectively. Over the following 25 years, the consumption of fried chicken and hamburgers rose to 60 million times, but the figure for pizza fell steeply by around 40 million times.
From 2005 to 2015, the consumption of hamburgers increased steadily by about 20 million times, and fried chicken consumption stayed at 60 million times in the first five years of this period, before rising slightly between 2010 and 2015. By contrast, pizza saw a decline in consumption of approximately 20 million times over the same 10-year period. By 2015, pizza consumption had dropped 10 million times, while the respective times that fried chicken and hamburgers are consumed had risen to about 62 million times and 70 million times.

Untitled.png
