halinh2000
Nov 8, 2022
Writing Feedback / The data regarding how the rates of birth fluctuated from 1920 to 2000 in China and USA [3]
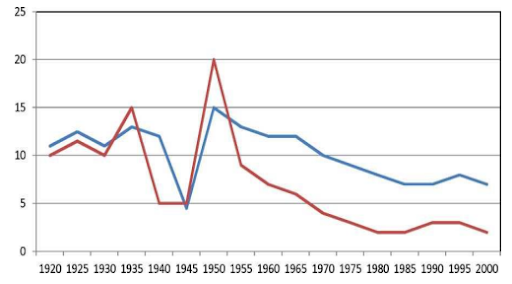
The given line graph illustrates data regarding how the rates of birth in China and the USA fluctuated from 1920 to 2000.
Overall, while both nations witnessed a general downward trend, the USA's birth proportion was slightly higher than that of China over the provided period.
In terms of the natality rate of America, although commencing at above 10% in 1920, the fertility percentage in this country took a dramatic plunge, hitting a low point at around 5% in 1945, then bouncing back to 15% for the following five years, at which point, the proportion showed a gradual decrease to roughly 7% in 2000.
Likewise, the Chinese counterpart underwent a comparatively similar pattern. Particularly, the fertility rate of China started at 10% in 1920, then fluctuated to 15% in 1935 before declining sharply to a plateau from 1940 to 1945. It was at this time that the volume demonstrated significant growth, reaching a peak of 20% in 1950. Since then, it fell steadily to approximately 3% in 2000.
changes in the birth rates - China vs USA
The given line graph illustrates data regarding how the rates of birth in China and the USA fluctuated from 1920 to 2000.
Overall, while both nations witnessed a general downward trend, the USA's birth proportion was slightly higher than that of China over the provided period.
In terms of the natality rate of America, although commencing at above 10% in 1920, the fertility percentage in this country took a dramatic plunge, hitting a low point at around 5% in 1945, then bouncing back to 15% for the following five years, at which point, the proportion showed a gradual decrease to roughly 7% in 2000.
Likewise, the Chinese counterpart underwent a comparatively similar pattern. Particularly, the fertility rate of China started at 10% in 1920, then fluctuated to 15% in 1935 before declining sharply to a plateau from 1940 to 1945. It was at this time that the volume demonstrated significant growth, reaching a peak of 20% in 1950. Since then, it fell steadily to approximately 3% in 2000.

unnamed.png
