binhminhtran24
Dec 16, 2022
Writing Feedback / The primary means of travelling adopted - IELTS WRITING TASK 1 PIE CHARTS [2]
(Pie charts attached at the end)
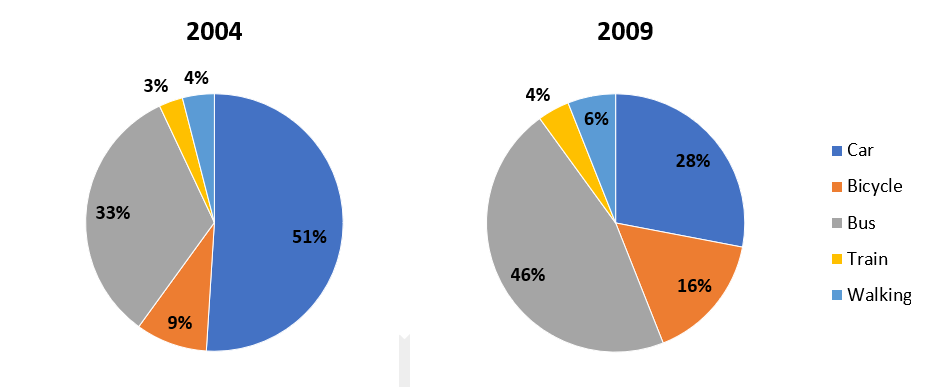
The pie charts compare the primary means of travelling adopted by people when coming to a university between 2004 and 2009.
Overall, all means of transport recorded an increase in its percentage apart from car and bicycle. It is also evident that car and bus were the two most popular sorts of movement, while the opposite was true for the others.
As it is explicitly observed from the charts, the number of cars used occupied the highest proportion, at around a half in 2004 before decreasing by nearly a quarter 5 years later. Bus, similarly, rose its popularity from 33% in 2004 to almost a half in 2009, making itself from the least prevalent to the most prevailing, at 46% in 2009.
Regarding the remaining types of vehicles, namely train, bicycle and walking, it was bicycle that remained unchanged at around one-tenth in both years. In the meantime, the figure for train slightly rose by a small fraction, invariably standing at the least popular kind of transport in two years. Likewise, the percentage of people going to university on foot increased marginally from 4% to 6% during the time period.
The charts show the main methods of transport of people travelling to one university in 2004 and 2009
(Pie charts attached at the end)
The pie charts compare the primary means of travelling adopted by people when coming to a university between 2004 and 2009.
Overall, all means of transport recorded an increase in its percentage apart from car and bicycle. It is also evident that car and bus were the two most popular sorts of movement, while the opposite was true for the others.
As it is explicitly observed from the charts, the number of cars used occupied the highest proportion, at around a half in 2004 before decreasing by nearly a quarter 5 years later. Bus, similarly, rose its popularity from 33% in 2004 to almost a half in 2009, making itself from the least prevalent to the most prevailing, at 46% in 2009.
Regarding the remaining types of vehicles, namely train, bicycle and walking, it was bicycle that remained unchanged at around one-tenth in both years. In the meantime, the figure for train slightly rose by a small fraction, invariably standing at the least popular kind of transport in two years. Likewise, the percentage of people going to university on foot increased marginally from 4% to 6% during the time period.

PieChart3.png
