vnahng
Jun 16, 2023
Writing Feedback / WRITING TASK 1: The graph shows the number of people taking parts in 4 kinds of sports [2]
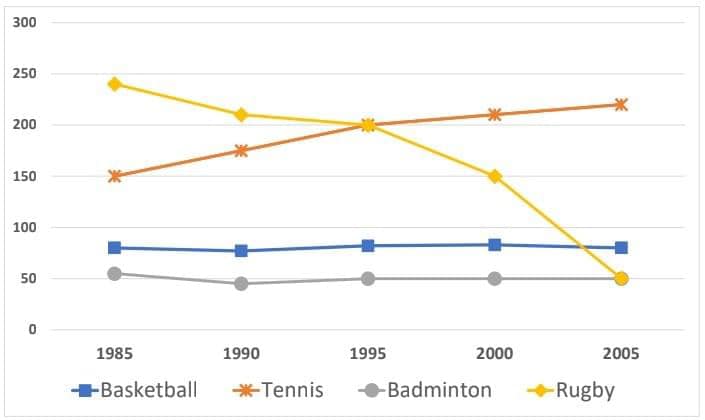
The graph shows the number of people taking parts in 4 kinds of sports in a particular region between 1985 and 2005.
The line graph compares the quantity of people who took parts in basketball, tennis, badminton and rugby in a particular region from 1985 to 2005.
It can be seen that tennis participants registered the highest figure in the period. In contrast, the figure for that of rugby decreased significantly and finished the period at the lowest place, which was the same as badminton players. In addition, the quantity of people playing basketball remained steady over the period supplied.
At the beginning of the period, the number of people taking parts in rugby was approximately 250, which was higher than that of tennis, at 150. From 1985 onwards, the trend of rugby decreased steadily to 50 in 2005, contrary to the upward trend of tennis, which reached about 225 at the end of the period.
For basketball and badminton, the figure for participants in 1985 was about 80 and 50, respectively. The number of people taking parts in basketball remained at around 85 during the given period. Similarity, after decreasing to 49, that of badminton stayed stable until 2005.
popularity of basketball, tennis, badminton and rugby
The graph shows the number of people taking parts in 4 kinds of sports in a particular region between 1985 and 2005.
The line graph compares the quantity of people who took parts in basketball, tennis, badminton and rugby in a particular region from 1985 to 2005.
It can be seen that tennis participants registered the highest figure in the period. In contrast, the figure for that of rugby decreased significantly and finished the period at the lowest place, which was the same as badminton players. In addition, the quantity of people playing basketball remained steady over the period supplied.
At the beginning of the period, the number of people taking parts in rugby was approximately 250, which was higher than that of tennis, at 150. From 1985 onwards, the trend of rugby decreased steadily to 50 in 2005, contrary to the upward trend of tennis, which reached about 225 at the end of the period.
For basketball and badminton, the figure for participants in 1985 was about 80 and 50, respectively. The number of people taking parts in basketball remained at around 85 during the given period. Similarity, after decreasing to 49, that of badminton stayed stable until 2005.

353636713_9136454297.jpg
