phydy314
Jul 29, 2023
Writing Feedback / IELTS 1: The charts below show the average percentage in typical meals of three types of nutrients [2]
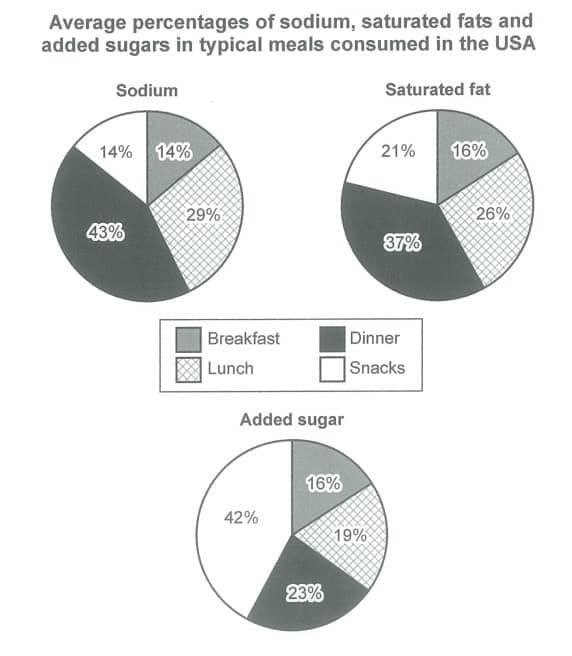
The given pie charts illustrate the proportions of 3 different unhealthy nutrients in general meals consumed in the United States of America.
According to the data, the percentages of Sodium and Saturated Fat in 4 meals is approximately the same. In comparison with Added sugar there are some significant differences.
Sodium and Saturated fat get the largest proportion in dinner, 43% and 37% respectively. Whereas there is almost a quarter for Sugar. On the other hand, the whole 3 nutrients are added least in breakfast with the fluctuating number between 14 and 16 percent.
The percentage of Sodium and Saturated Fat in lunch is about one in four compared to Added Sugar is a bit smaller, 19 per cent. The most distinct feature is the nutrients in Snack, which account for the biggest part of sugar (42%) as opposed to 14 percent of Sodium and 21 percent Saturated fat.
Sugar, Sodium and Saturated Fat in american meals
The given pie charts illustrate the proportions of 3 different unhealthy nutrients in general meals consumed in the United States of America.
According to the data, the percentages of Sodium and Saturated Fat in 4 meals is approximately the same. In comparison with Added sugar there are some significant differences.
Sodium and Saturated fat get the largest proportion in dinner, 43% and 37% respectively. Whereas there is almost a quarter for Sugar. On the other hand, the whole 3 nutrients are added least in breakfast with the fluctuating number between 14 and 16 percent.
The percentage of Sodium and Saturated Fat in lunch is about one in four compared to Added Sugar is a bit smaller, 19 per cent. The most distinct feature is the nutrients in Snack, which account for the biggest part of sugar (42%) as opposed to 14 percent of Sodium and 21 percent Saturated fat.

Pie charts
