summerchilld
Jan 13, 2024
Writing Feedback / IELTS task 1 report on Dairy products [3]
The report below is my answer to the charts attached. I would be really thankful if you give me feedback (and maybe the possible band). Thank you so much!!!
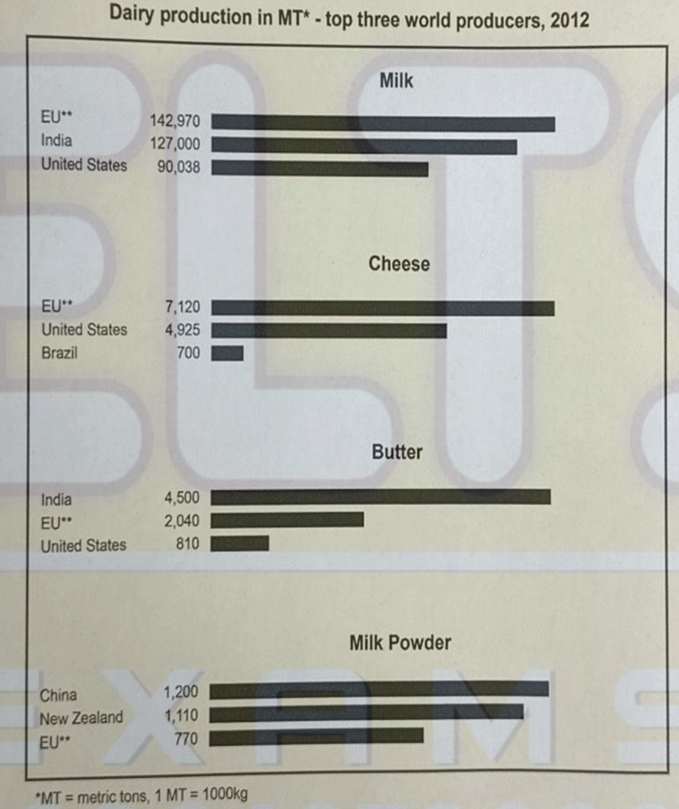
The charts highlight data on the ranking of the global top three producers of four different dairy products: milk, cheese, butter, and milk powder in the year of 2012.
Overall, it can be seen that milk and milk powder were the two market that producers held balance shares, while in that of cheese and butter, there was a huge gap between the number-one producers and their runner-ups. Another striking point is that in the world of dairy producers, EU countries, and the US contributed the most in total of the four products.
In the milk industry EU took the lead with the massive number of 142,970 MT of milk produced, being 20,000 MT more than the second-placed, India, while the US came third with 90,000 MT. Meanwhile, when it comes to the milk powder market, it is China who finished first as they contributed 1200 MT milk powder to the world. New Zealand were closely behind with 30,000 MT of powder left. However, the EU nations, only produced 770 MT, being a half of that of China.
Moving on to the other two market, EU countries and the US are still giants. In the cheese market, although Brazil's production were as little as 700 MT, that of the US were just under 5000 MT, creating a considerable leap in terms of mass production. What is more, EU producers finished at an even bigger number of over 7000 MT, which was 10 times bigger than that of Brazil. Finally, India although topped the chart in butter production with 4,500 MT, EU and the US are still in the top three with 2040 and 810 MT of butter contributed to the world, respectively.
From the chart, it can be deduced that milk and cheese are the two most widespread dairy products.

Screenshot2023112.jpg
