kvpa915gstn
Jun 26, 2024
Writing Feedback / Ielts writing task 1: average CO2 emissions per person in the UK, Sweden, Italy, Portugal [4]
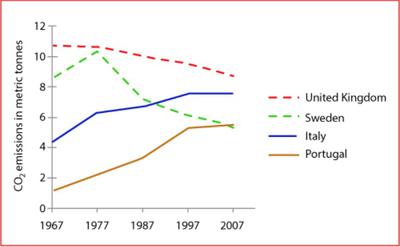
Question: The graph below shows average carbon dioxide (CO2) emissions per person in the United Kingdom, Sweden, Italy and Portugal between 1967 and 2007. Summarize the information by selecting and reporting the main features, and make comparisons where relevant.
The line graph illustrates the amount of carbon dioxide (CO2) emitted per person in four countries from 1967 to 2007.
Overall, there was a decline in the average CO2 emissions per person in the UK and Sweden, while a rise was seen in Italy and Portugal. In addition, the United Kingdom generally had the highest figures throughout the period.
The amount of CO2 produced per person in the UK started at close to 11 metric tonnes (mt), after which it experienced a steady decrease to 10 in 1987, before ending the period at around 9 mt. Meanwhile, the figure for Sweden in 1967 was roughly 9 mt, followed by a significant increase to just over 10 mt in 1977, and a final drop to about 5,5 30 years later.
Approximately 4 mt was emitted by an average person in Italy in 1967, with an increase to about 8 mt in 1997 and remained relatively unchanged until 2007. Similarly, Portugal's figure saw a considerable growth of around 4,5 mt between 1967 and 1997 and remained at roughly 5,5 mt until 2007.

ieltslinegraphco2.jpg
