nhatminhdeptrai
Aug 25, 2024
Writing Feedback / Ielts writing about main fuels in the production in UK from 1981 to 2000 [3]
Ielts writing about main fuels in the production in UK from 1981 to 2000
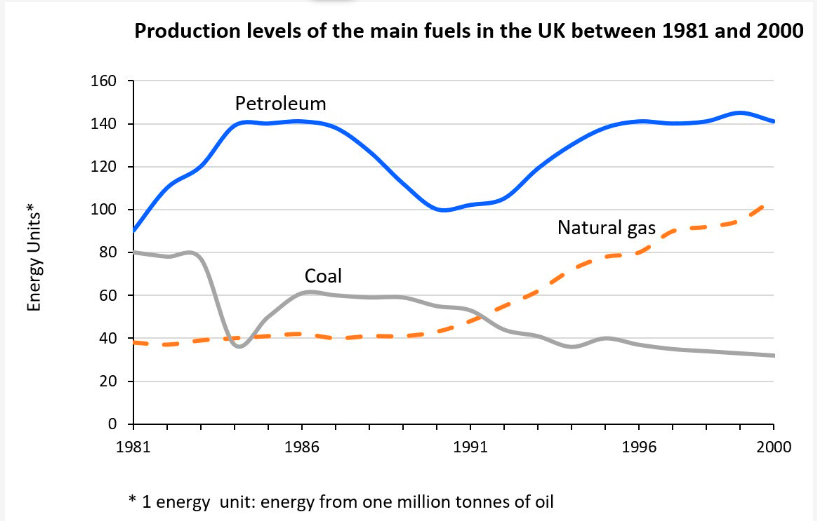
The line graph presents the production levels of various fuels in the United Kingdom from 1981 to 2000. Most fuels experienced an upward trend, except for coal. Notably, petroleum exhibited significant fluctuations throughout the period.
In 1981, natural gas had the lowest production level, with approximately 40 energy units. Over the years, natural gas fluctuated slightly and reached a peak of over 100 energy units in 2000. In contrast, coal production rapidly declined from the initial units in 1981 to under 40 units in 1984. Subsequently, it fluctuated for 16 years before hitting a low of around 35 units in 2000.
Furthermore, in 1981, petroleum held the highest production level at nearly 100 units. It experienced fluctuations, reaching a low of 100 units in 1990, but then rebounded in the subsequent years. Its peak was recorded in 1999 at over 140 units before declining to 140 units in 2000.

Screenshot2024082.png
