ttrangthao
Sep 13, 2024
Writing Feedback / Average carbon dioxide emissions per person in the United Kingdom, Sweden, Italy, Portugal [2]
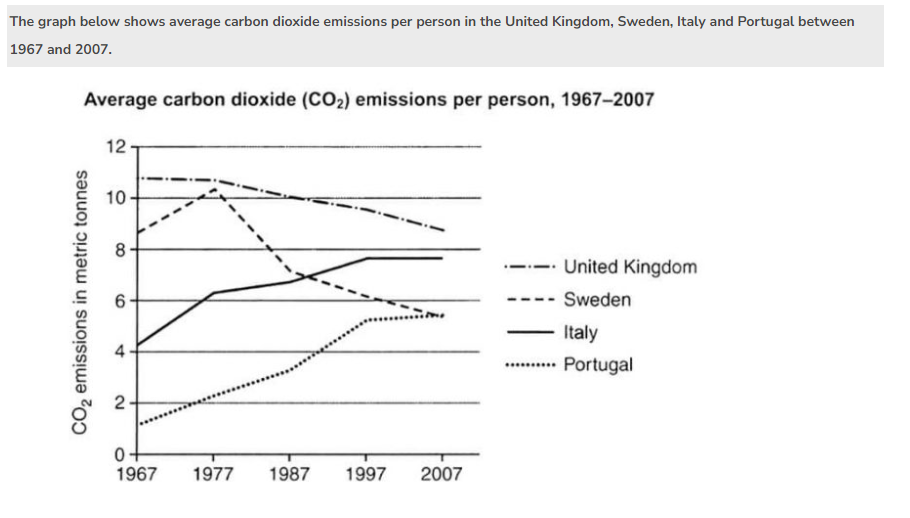
The line chart depicts the average amount of carbon dioxide emissions of each person in four different nations namely the United Kingdom, Sweden, Italy and Portugal from 1967 to 2007.
Overall, there were two trends in this graph.The figure of carbon dioxide emissions in Portugal and Italy saw an upward trend over the period, whereas the figure of that in the United Kingdom and Sweden witnessed a remarkable decrease in the second half of the period.
In terms of Italy and Portugal carbon dioxide emissions, there was a gradual increase in 1967 to 1987 with approximately 1,8 tonnes to around 3.7 tonnes in Portugal. The same trend was seen in the figure of carbon dioxide in Italy from over 4 tonnes to around 6,7 tonnes in the similar period. From 1987 to 2007, both average carbon dioxide emissions of Italy and Portugal witnessed a steady climb to approximately 5,8 tonnes and around 7,8 tonnes, respectively.
By contrast, the average levels of carbon dioxide emissions in Sweden fluctuated in the first half of the period from 8,8 tonnes in 1967 to around 7 tonnes in 1987, while the proportion of that in the United Kingdom dropped slightly in the same period from over 10 tonnes to 10 tonnes . The remaining stage, the figure of both carbon dioxide emissions of the United Kingdom and Sweden witnessed a significant decline at 8 tonnes and over 5,2 tonnes, respectively in 2007.

Screenshot2024091.png
