don
May 27, 2012
Writing Feedback / (Hamburger, Fish & Chips, Pizza) - IELTS - help with writing task 1 line graph [NEW]
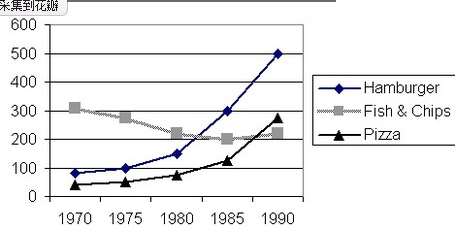
Question and line graph is the attached .png
My task 1 writing is below
The presented information from the line graph is about three types of fast food consumed in British for twenty years from 1970 to 1990, namely Hamburger, Fish & Chips and Pizza. Overall, it is evident that the fish consumption descended, whereas Hamburger and Pizza consumed climbed to different extents throughout the period.
It is apparent that the pizza consumption increased accelerately over the period, from around 50 in 1970 to approximately 270 in 1990.
Interestingly, the similar trend was found on hamburger. In comparison to Pizza, hamburger consumed went up in a faster pace from roughly 85 per week, surged to 500 per week after 1980.
On the contrary, the same period witnessed a downward trend in fish and chips consumed, which declined from historical high (300), bottomed-out around 200 in 1985, then recover slightly.
The data recorded lead us to the conclusion that throughout the period between 1970 to 1990, hamburger and pizza consumption increased at different levels, whilst fish & chips become less and less on the table for British citizens.

hamburger.png
