Ksangha
Sep 21, 2014
Writing Feedback / Line graph; percentage of radio and television spectators around the clock in UK in year 1992 [2]
Writing task 1
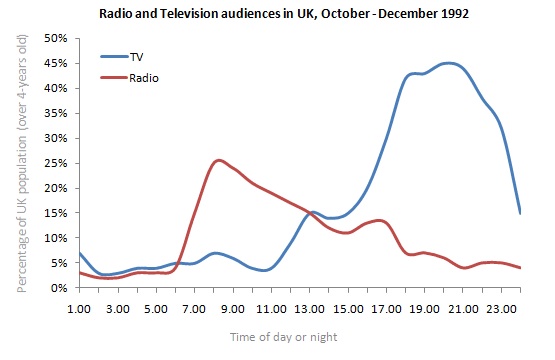
The line graph compares percentage of radio and television spectators around the clock in uk in year 1992
To start with, viewers of television recorded much smaller figures (3% to 7%) in the morning hours that was from 1am to 11am ,which was followed by twice figures at 1pm . From 4pm onwards percentage of television audience rose sharply and peak value was recorded at 21st hour of the day (43%) and that peak was preceded by dramatic decline to 15% at mid night .
In case of radio listeners ,figures followed up almost same trend as that of television watchers in early morning hours (till 6 am) which accounted for only 3%. However highest percentage of radio hears was noted at 8 o clock in the morning (25%). In between 9am and 2pm figures of radio listeners were plunged by 10%. In the following hours there were fluctuations in the proportion of radio audient with general downward trend reaching to bottom figures of 3% at mid night (same as that of 1am)
To sum up ,people were interested in listening to radio in the morning while in the late evening or night maximum spectators were of television .
Is this graph 7 band???

image.jpg
