ali98
Dec 24, 2016
Writing Feedback / IELTS task1: spending on different items in the UK (Table) [2]
Hello everyone, hope someone could check this for me.
the graph is attached.
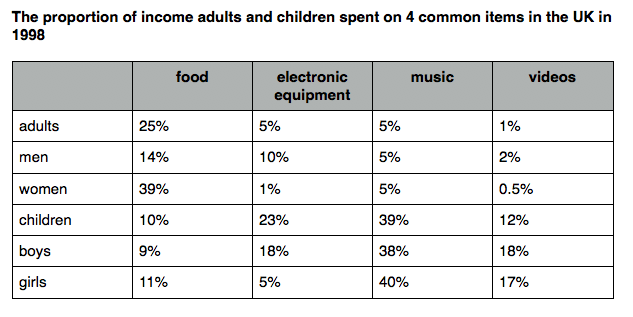
The table compares the percentage of income that adults and children spent on four different categories in the UK in the year 1998.
It is clear that adults spent the largest proportion of their income on food, while for children the most spending went for music. Spending on videos was by far the lowest for adults.
Overall adults spent 25% of their income on food which is the highest spending among adults, the figure was considerably different in terms of gender, at 39% for women and only 14% for men; whereas, the children spent only 10% of their income on food. By contrast, the largest proportion of income spending among children was on music at 39% with a slight disparity between boys and girls; spending on music for adults was 5% for both men and women.
It can be seen that women had the lowest percentage of spending on videos and on electric equipment at 0.5% and 1% of income respectively. These figures for men was rather higher at 2% on videos and 10% on electrical equipment. At the same time, the proportion of spending by children electrical equipment was 23% while 12% of their income went to videos.
Hello everyone, hope someone could check this for me.
the graph is attached.
Money allocation in the UK
The table compares the percentage of income that adults and children spent on four different categories in the UK in the year 1998.
It is clear that adults spent the largest proportion of their income on food, while for children the most spending went for music. Spending on videos was by far the lowest for adults.
Overall adults spent 25% of their income on food which is the highest spending among adults, the figure was considerably different in terms of gender, at 39% for women and only 14% for men; whereas, the children spent only 10% of their income on food. By contrast, the largest proportion of income spending among children was on music at 39% with a slight disparity between boys and girls; spending on music for adults was 5% for both men and women.
It can be seen that women had the lowest percentage of spending on videos and on electric equipment at 0.5% and 1% of income respectively. These figures for men was rather higher at 2% on videos and 10% on electrical equipment. At the same time, the proportion of spending by children electrical equipment was 23% while 12% of their income went to videos.

shoppingtable3.png
