baonhisu
May 11, 2017
Writing Feedback / The line graph: tourists to England who visited four different attractions in Brighton. [2]
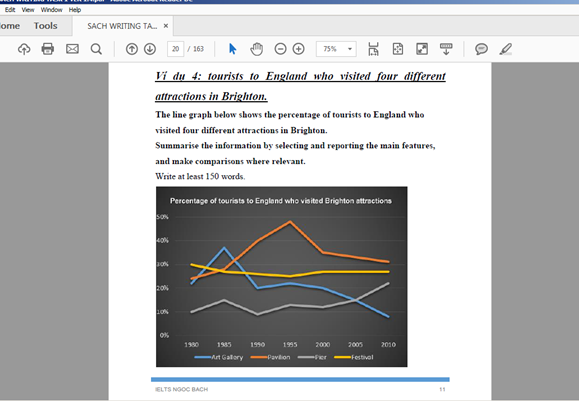
The line graph compares the proportion of visitors to England who went to four attractions in Brition in the period between 1980 and 2010.
Overall, only the Pavilon and the Pier saw an increase in the number of tourist visiting them over the period of 30 years while the figures for the other attractions fell.
It can be seen from the graph that in 1980,the Festival accounted for the highest number of visitors with exactly 30%. The percentage of tourists to the Pavilon and the Art Gallery were lower, both were roughly under 25%. However, the figure for Pier was the lowest, at only 10%.
Over the 30-year period, Brighton witnessed a fluctuating increase to approximately 30% in the number of tourists to Pavilon. By contrast, there was a steady decrease to around 28% in the figure for Festival in 2010, but this was still higher than the one of the Pier which was roughly over 20%. Although the percentage visting the Art Gallery reached a peak of about 35% in 1985, this dropped significantly to just under 10% at the end of the period.
tourists in brighton looking for fun
The line graph compares the proportion of visitors to England who went to four attractions in Brition in the period between 1980 and 2010.
Overall, only the Pavilon and the Pier saw an increase in the number of tourist visiting them over the period of 30 years while the figures for the other attractions fell.
It can be seen from the graph that in 1980,the Festival accounted for the highest number of visitors with exactly 30%. The percentage of tourists to the Pavilon and the Art Gallery were lower, both were roughly under 25%. However, the figure for Pier was the lowest, at only 10%.
Over the 30-year period, Brighton witnessed a fluctuating increase to approximately 30% in the number of tourists to Pavilon. By contrast, there was a steady decrease to around 28% in the figure for Festival in 2010, but this was still higher than the one of the Pier which was roughly over 20%. Although the percentage visting the Art Gallery reached a peak of about 35% in 1985, this dropped significantly to just under 10% at the end of the period.

writing_task_1.png
