hello_dmmm
May 27, 2017
Writing Feedback / The total number of minutes (in billions) of telephone calls in the UK, divided into 3 categories [2]
Dear all,
I have just written Task 1 for Cambridge IELTS 9, test 2. Please help me correct it. Thank you so much for your help!!
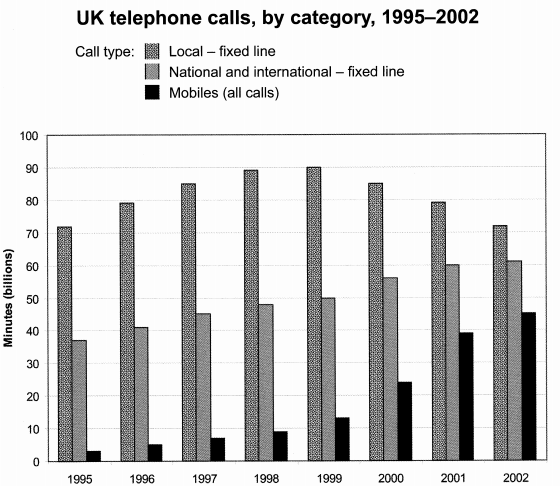
The chart below shows the total number of minutes (in billions) of telephone calls in the UK, divided into three categories, from 1995-2002.
The chart compares the time spent by UK residents on different types of telephone calls between 1995 and 2002.
Overall, while most of the UK citizens made local calls and the popularity of cell phones increased rapidly, the amount of time used for making local fixed line calls witnessed a downward trend compared to the other figures over the last four years of the period.
In 1995, more than 70 billion minutes were spent by people who made local fixed line calls while the figure for national and international fixed line calls and cell phone calls stood at 37 and only 3 billion minutes, respectively. The use of local fixed line went up steadily and reached a peak of 90 billion minutes, however, it then began to fall to about 72 billion in 2002.
Meanwhile, the national & international-fixed dial call type increased gradually by around 22 billion in 2002 from the initial figure of 38 billion in 1995. Similarly, there was a gradual rise in mobile phone calls to nearly 10 million in 1998, and then it continued its upward trend in the next four years to peak at 45 billion in 2002.
(191 words)
Cambridge IELTS 9, Test 2, task 1
Dear all,
I have just written Task 1 for Cambridge IELTS 9, test 2. Please help me correct it. Thank you so much for your help!!
The chart below shows the total number of minutes (in billions) of telephone calls in the UK, divided into three categories, from 1995-2002.
The chart compares the time spent by UK residents on different types of telephone calls between 1995 and 2002.
Overall, while most of the UK citizens made local calls and the popularity of cell phones increased rapidly, the amount of time used for making local fixed line calls witnessed a downward trend compared to the other figures over the last four years of the period.
In 1995, more than 70 billion minutes were spent by people who made local fixed line calls while the figure for national and international fixed line calls and cell phone calls stood at 37 and only 3 billion minutes, respectively. The use of local fixed line went up steadily and reached a peak of 90 billion minutes, however, it then began to fall to about 72 billion in 2002.
Meanwhile, the national & international-fixed dial call type increased gradually by around 22 billion in 2002 from the initial figure of 38 billion in 1995. Similarly, there was a gradual rise in mobile phone calls to nearly 10 million in 1998, and then it continued its upward trend in the next four years to peak at 45 billion in 2002.
(191 words)

Capture.PNG
