abubakar07
Aug 11, 2017
Writing Feedback / The pie chart compares the proportion of energy production in four different energy sources [3]
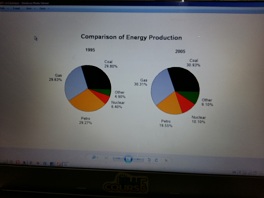
The pie chart compares the proportion of energy production in four different energy sources between 1995 and 2005. It is measured in the percentage of the production of energy.
Overall, it can be seen that the greatest change was in the percentage of Petro production.
In 1995, the most energy production was Coal at just under 30%, representing less than a third of all energy production and then by 2005 it rose to 30.93%. Following that, Gas was the second most energy production, and it also increased at 30.31% in 2005. However, in 1995 was the third most energy production but this decreased dramatically in 2005 at almost 20.00%.
Another change was seen in the remaining two energy productions such as Nuclear and Other energy. There was a gradual growth in nuclear production in 2005 at more than 10%. 2005 experience a sharp growth in other energy production at less than one in ten.
Comparison Of Energy Production
The pie chart compares the proportion of energy production in four different energy sources between 1995 and 2005. It is measured in the percentage of the production of energy.
Overall, it can be seen that the greatest change was in the percentage of Petro production.
In 1995, the most energy production was Coal at just under 30%, representing less than a third of all energy production and then by 2005 it rose to 30.93%. Following that, Gas was the second most energy production, and it also increased at 30.31% in 2005. However, in 1995 was the third most energy production but this decreased dramatically in 2005 at almost 20.00%.
Another change was seen in the remaining two energy productions such as Nuclear and Other energy. There was a gradual growth in nuclear production in 2005 at more than 10%. 2005 experience a sharp growth in other energy production at less than one in ten.

20170808_143832.jpg
