Writing Feedback /
(IELTS Task 1) The graph below shows the proportion of four different materials that were recycled.. [3]
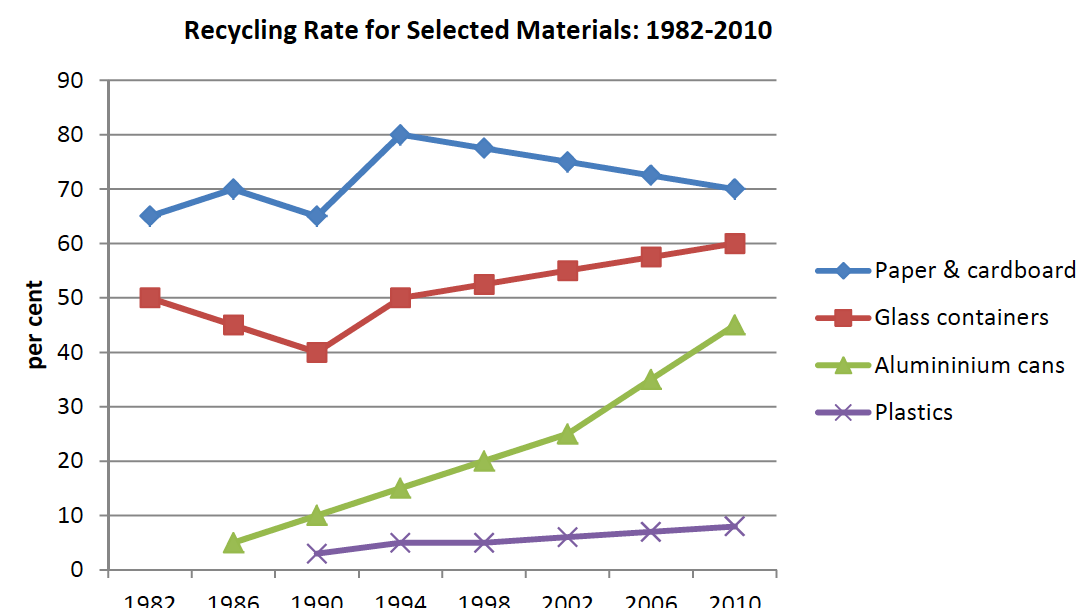
The graph below shows the proportion of four different materials that were recycled from 1982 to 2010 in a particular country.
Summarise the information by selecting and reporting the main features, and make comparisons where relevant.recycling materials proportion
The chart shows the percentage of paper and cardboard, glass containers, aluminum cans and plastics that were recycled in one country between 1982 and 2010.
In 1982, about 65% of paper and cardboard was recycled. This figure fluctuated before rising steeply to reach a peak 80% in 1994. From then on, however, it decreased steadily to a level of 70% in 2010. In 1982, half of all glass containers were recycled; after dipping to a low of 40% in 1990, the glass recycling rate gradually increased to 60% by 2010.
Aluminum cans were first recycled in 1986, starting at about 5%, but this figure climbed rapidly over 25 years and by 2010 it had reached 45%. Recycling of plastics, on the other hand, was not introduced until 1990 and, although the growth in this category was also constant, it was very slow, rising from about 2% to around 8% over the period.
Overall, the proportion of paper and cardboard that was recycled was the highest of the four class of material, but this category experienced a decline after 1994, whereas there was a continuing upward trend in the recycling of the other materials.

zee.png

