HanhNguyen
Aug 20, 2018
Writing Feedback / The line graph illustrates figures for global meetings in three different capital cities 1980-2010 [2]
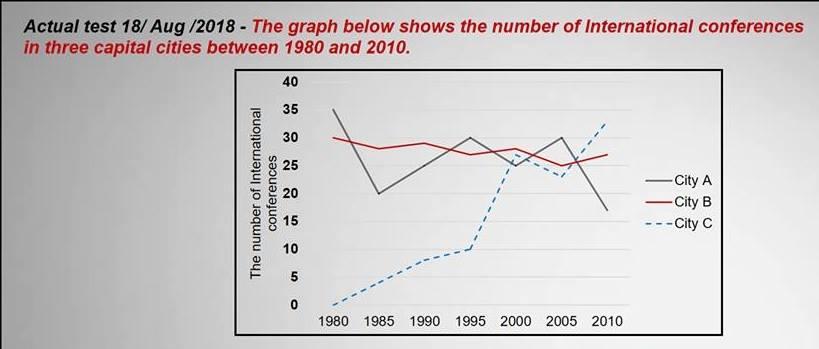
The line graph illustrates figures for global meetings in three different capital cities from 1980 to 2010.
Overall, the most dramactic increase can be seen in the number of international conferences in city C. Meanwhile, while city A saw a significant fluctuation in the figure for meetings which were held globally, this number for city B experienced a period of stability with a slight change.
In the year 1980, 35 meetings were held in city A, which was the highest number among three capital cities. The figure for international meetings in city B was lower, with the total of 30 conferences, whereas City C did not held any meeting in this year. By contrast, in the next 20 years, there was a considerable growth in the number of conferences which were held in city C, to around 27 meetings, surpassing this figure for city A. The number of global meeting in city B remained stable, at around 28 conferences at the same time.
From 2005 to 2010, an opposite trend can be seen in the amount of global conferences in two cities A and C. This number for city C reached its peak of the period, at around 33 meetings, whereas city A fell sharply to hit the lowest point, at 17 conferences 2010. 27 is the total number of international meetings which were organized in city B in the same year.
International conferences
The line graph illustrates figures for global meetings in three different capital cities from 1980 to 2010.
Overall, the most dramactic increase can be seen in the number of international conferences in city C. Meanwhile, while city A saw a significant fluctuation in the figure for meetings which were held globally, this number for city B experienced a period of stability with a slight change.
In the year 1980, 35 meetings were held in city A, which was the highest number among three capital cities. The figure for international meetings in city B was lower, with the total of 30 conferences, whereas City C did not held any meeting in this year. By contrast, in the next 20 years, there was a considerable growth in the number of conferences which were held in city C, to around 27 meetings, surpassing this figure for city A. The number of global meeting in city B remained stable, at around 28 conferences at the same time.
From 2005 to 2010, an opposite trend can be seen in the amount of global conferences in two cities A and C. This number for city C reached its peak of the period, at around 33 meetings, whereas city A fell sharply to hit the lowest point, at 17 conferences 2010. 27 is the total number of international meetings which were organized in city B in the same year.

39454461_10745345093.jpg
