rus147
Jun 4, 2019
Writing Feedback / Writing task 1: Line graph shows the percentage of tourists.... [2]
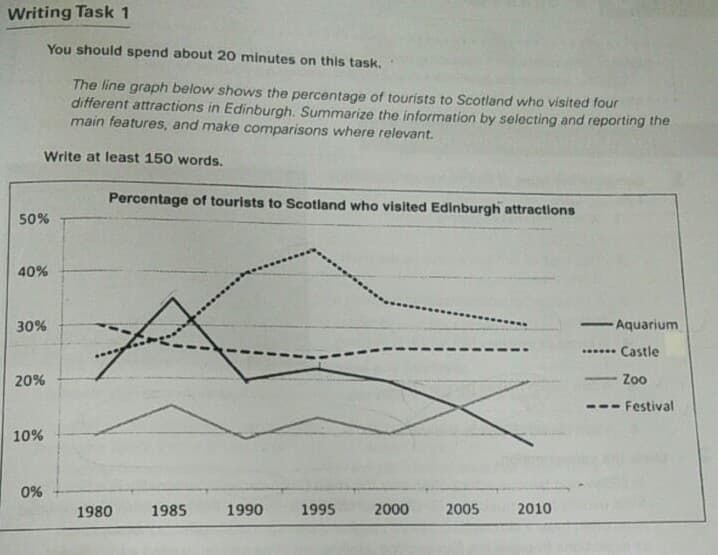
The line graph illustrates the proportion of people to Scotland who visited four different temptations in Edinburgh.
Roughly speaking, the total amount of tourists who visited had a fluctuation for these years. It is worth noting that the figure for travellers who visited zoo increased dramatically, while the number of people who came to aquarium fell substantially.
In 1980, the figure for people who visited festival peaked at 30%. Fewer tourists came to aquarium and castle with 20% and about 24% respectively. Nevertheless, the number of visitors went to zoo hit to the lowest point of 10%.
By 2010, the amount of tourists who came to these places fluctuated except festival. We can see that the trend for festival was similar. The proportion of people who visited zoo fluctuated between 10% and 20% from 1980 to 2010. There was a sharp increase in tourists who visited aquarium from 20% to about 35% between 1980 and 1985 then fell substantially to about 8% in 2010. Most tourists wen to castle in the year 1995. There was a gradual increase from about 24% to about 44% by the first half of 1995. The amount of people descended gradually form about 44% to about 31% till 2010.
visitors of Edinburgh attractions
The line graph illustrates the proportion of people to Scotland who visited four different temptations in Edinburgh.
Roughly speaking, the total amount of tourists who visited had a fluctuation for these years. It is worth noting that the figure for travellers who visited zoo increased dramatically, while the number of people who came to aquarium fell substantially.
In 1980, the figure for people who visited festival peaked at 30%. Fewer tourists came to aquarium and castle with 20% and about 24% respectively. Nevertheless, the number of visitors went to zoo hit to the lowest point of 10%.
By 2010, the amount of tourists who came to these places fluctuated except festival. We can see that the trend for festival was similar. The proportion of people who visited zoo fluctuated between 10% and 20% from 1980 to 2010. There was a sharp increase in tourists who visited aquarium from 20% to about 35% between 1980 and 1985 then fell substantially to about 8% in 2010. Most tourists wen to castle in the year 1995. There was a gradual increase from about 24% to about 44% by the first half of 1995. The amount of people descended gradually form about 44% to about 31% till 2010.

linegraphpic.jpg
