Writing Feedback /
Information about how much of carbon dioxide is discharged in the UK, Sweden, Italy, and Portugal [4]
carbon dioxide (CO2) 1967-2007
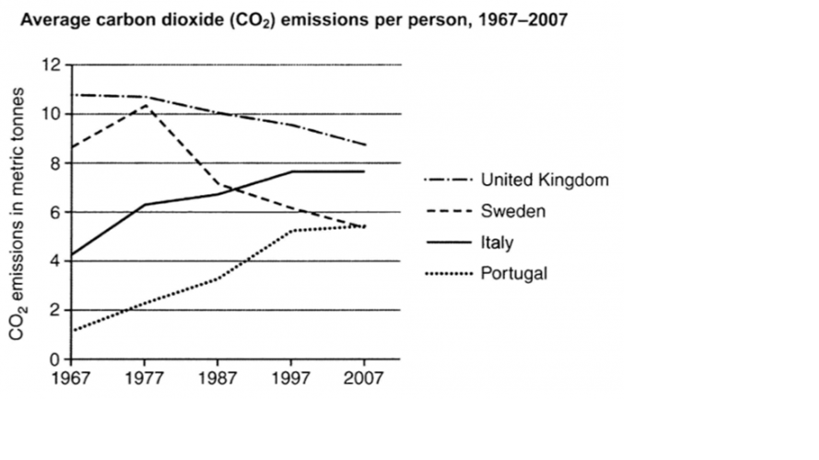
The graph illustrates information about how much average carbon dioxide is discharged by each inhabitant in the United Kingdom, Sweden, Italy, and Portugal in a 50-year period, from 1967 to 2007.
Overall, while CO2 emissions per person in the UK and Sweden decreased, Italy and Portugal's counterparts witnessed upward trends. In addition, the amount of CO2 exhausted in the UK stood for first place over the period.
Regarding Portugal, despite going up significantly from 1.3 metric tonnes in 1967 to 5.5 metric tonnes in 2007, the amount of carbon dioxide released was still lower than those of other countries. There was a similar trend in the CO2 emissions of each individual in Italy. The figure in 1967 was 4.2 metric tonnes, which was three times as much as that of Portugal, then increased considerably throughout 50 years to 7.8 in 2007.
By contrast, the average amount of CO2 discharged by citizens in Sweden saw remarkable growth in the first 10 years, from 8.5 to 10.2 metric tonnes, then plummeted to 5.5 metric tonnes, which was the same as Portugal counterpart. In terms of the UK, despite decreasing slightly from 10.5 to 8.4 metric tonnes, the figure was the largest of the four countries.

Untitled.png

