yellowhead21
Oct 24, 2019
Writing Feedback / The charts of the domestic energy use in six different activities and the greenhouse gas emission [2]
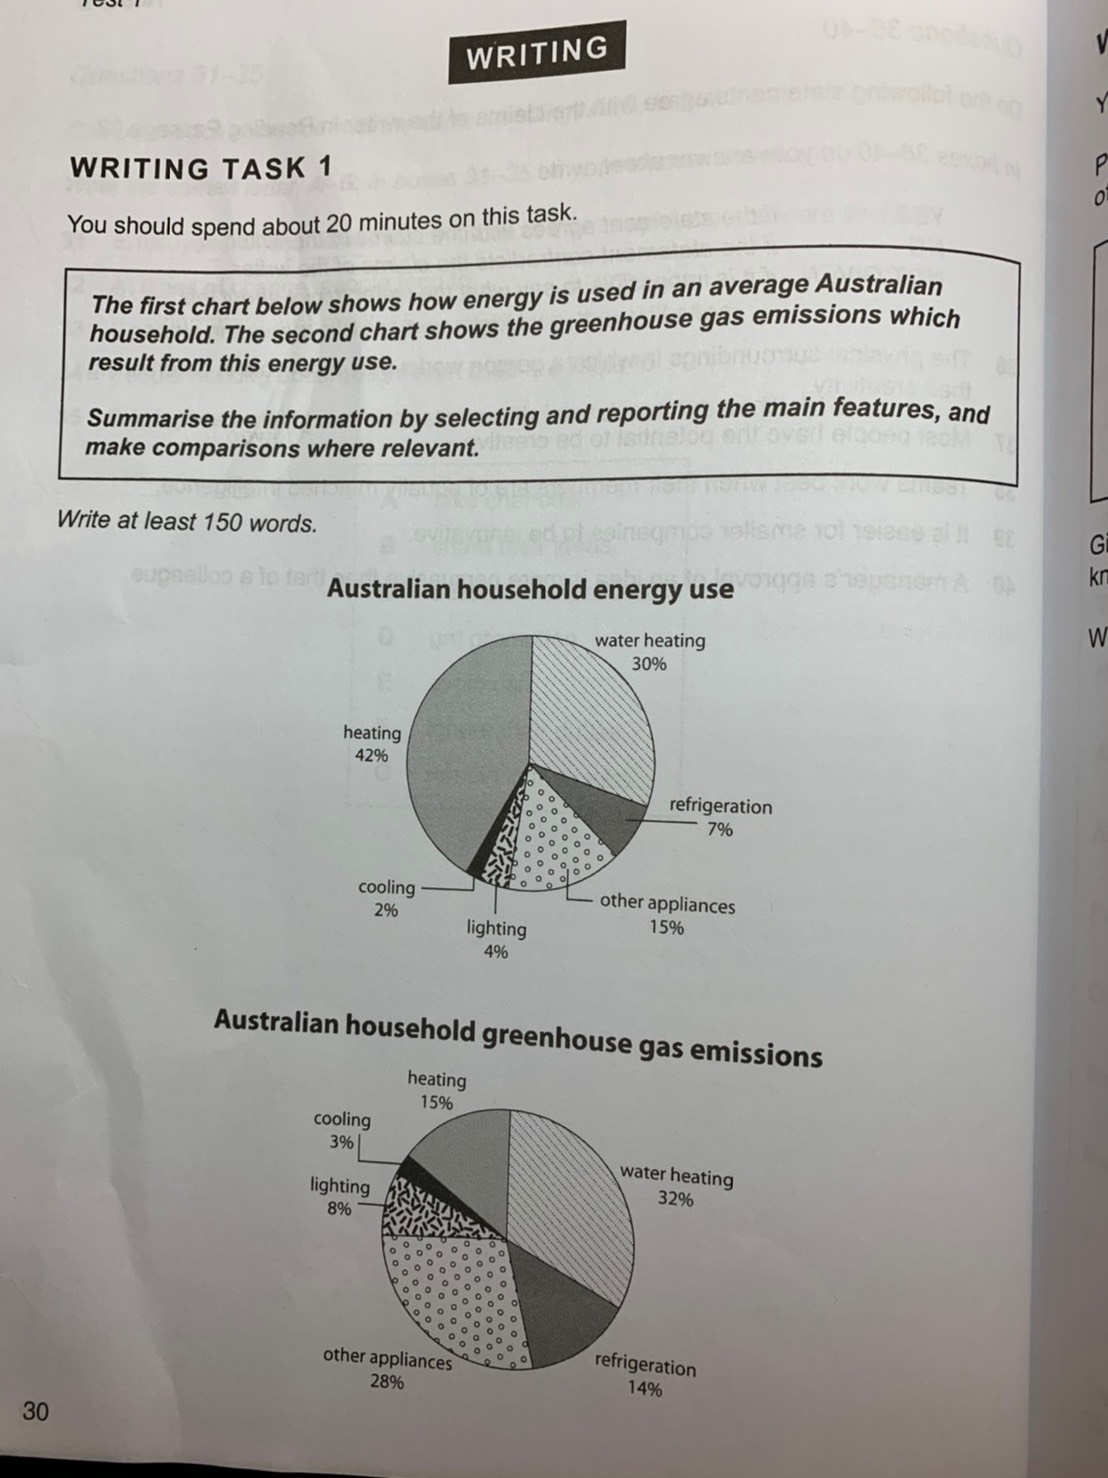
The two pie charts show the domestic energy use in six different activities and the greenhouse gas emitted from those in an average Australian household.
It is noticeable that water heating is both the major energy-consumed and greenhouse-gas-emitted activity. By contrast, cooling uses the least energy and also makes the least greenhouse gas emissions.
Looking in more details, water heating consumes 30% of total energy, only second to heating, which accounts for 42%. Also, it emits much greenhouse gas, at 42%, being the main source of emissions. However, even if heating uses the most energy, it doesn't emit the most greenhouse gas, only at 15%. Cooling is the steadies one, having the least figure in both charts, at 2% and 3%, respectively.
In other activities, the proportions of the total greenhouse gas they release are twice as much as those of the total energy they use. Refrigeration uses 7% of energy and gives out 14%. Lighting shows the same character, at 4% and 8%. Other appliances accounts for 15% of total energy use, and results in 28% of total greenhouse gas emissions, also twice its consumption.
IELTS Writing Task 1 - charts analysis
The two pie charts show the domestic energy use in six different activities and the greenhouse gas emitted from those in an average Australian household.
It is noticeable that water heating is both the major energy-consumed and greenhouse-gas-emitted activity. By contrast, cooling uses the least energy and also makes the least greenhouse gas emissions.
Looking in more details, water heating consumes 30% of total energy, only second to heating, which accounts for 42%. Also, it emits much greenhouse gas, at 42%, being the main source of emissions. However, even if heating uses the most energy, it doesn't emit the most greenhouse gas, only at 15%. Cooling is the steadies one, having the least figure in both charts, at 2% and 3%, respectively.
In other activities, the proportions of the total greenhouse gas they release are twice as much as those of the total energy they use. Refrigeration uses 7% of energy and gives out 14%. Lighting shows the same character, at 4% and 8%. Other appliances accounts for 15% of total energy use, and results in 28% of total greenhouse gas emissions, also twice its consumption.

S__9166852.jpg
