Thieu Quynh
Aug 3, 2020
Writing Feedback / TASK 1: information on the percentage of people who were unemployed in the US and Japan [2]
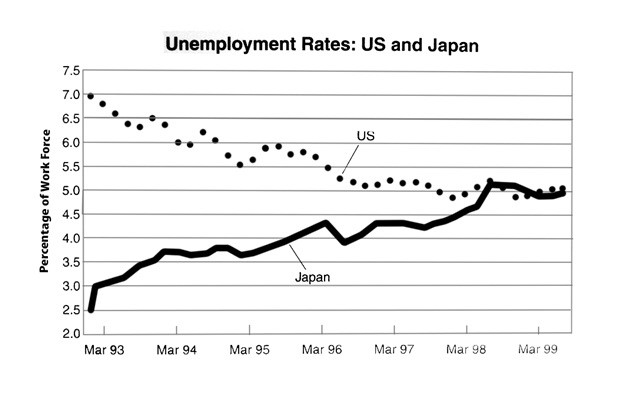
The line graph provides information on the percentage of people who were unemployed in the US and Japan from March 1993 to March 1999.
It can be seen from the graph that the US and Japan followed the opposite pattern between 1993 and 1999. At the beginning, while US had the highest figure for the percentage of people who didn't have a job, Japan started at the lowest point.
Getting into the details, in 1993, in spite of more unemployed workers in the US than in Japan, with 7% and 2.5% respectively, two countries both ended with around 5% in 1999. With regard to the US, the unemployment rate decreased significantly from 1993 to 1996, and then fluctuated mildly around 5% until the end of the period. On the contrary, Japan's percentage of the unemployed witnessed a considerable growth of 2.5% and reached a peak at roughly 5.5% in March 1998.
Unemployment rates: usa and Japan
The line graph provides information on the percentage of people who were unemployed in the US and Japan from March 1993 to March 1999.
It can be seen from the graph that the US and Japan followed the opposite pattern between 1993 and 1999. At the beginning, while US had the highest figure for the percentage of people who didn't have a job, Japan started at the lowest point.
Getting into the details, in 1993, in spite of more unemployed workers in the US than in Japan, with 7% and 2.5% respectively, two countries both ended with around 5% in 1999. With regard to the US, the unemployment rate decreased significantly from 1993 to 1996, and then fluctuated mildly around 5% until the end of the period. On the contrary, Japan's percentage of the unemployed witnessed a considerable growth of 2.5% and reached a peak at roughly 5.5% in March 1998.

abc.jpg
