nhuquinhh
May 16, 2020
Writing Feedback / The line graph illustrates the number of people aged 65 and more - over 100 years period [2]
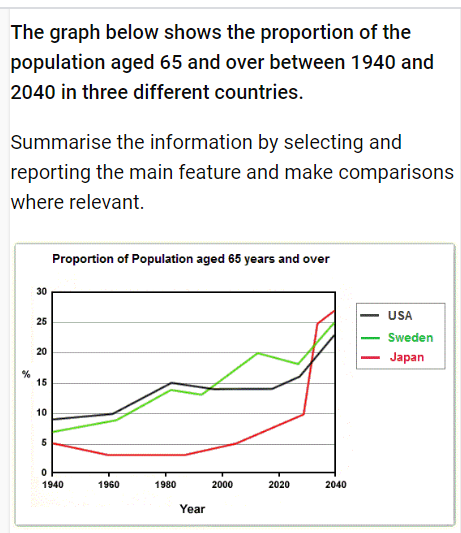
The line graph illustrates the number of people living in three different countries (USA, Sweden and Japan) aged 65 and more than over 100 years from 1940 to 2040. Units are measured in percentage.
Overall, the percentage of the population aged 65 and over increase over the period given. At the start of the period, American accounted for the highest proportion among three countries, while Japan is predicted that it will replace the United States in 2040.
Between 1940 and 2020, USA and Sweden experienced an oscillation in the percentage of people aged 65 and over. In 1940, around 10% of people in America aged 65 and over compared to about 8% in Sweden. While as, the number of Japanese people living considerably more than 65 just over 5% and this number is the lowest among three countries during this period.
In the next 20 years, the percentage of three countries are predicted that will almost increase. There was an dramatically growth in Japan in the 1930s with the highest percentage will be at 25%. In 2040, it is thought that nearly 28% Japanese will be 65 and more, while the figure for Sweden and the US will be more gradually lower at 25% and approximately 23% respectively.
iELTS WRITING TASK 1 ACADEMIC - LINE GRAPH
The line graph illustrates the number of people living in three different countries (USA, Sweden and Japan) aged 65 and more than over 100 years from 1940 to 2040. Units are measured in percentage.
Overall, the percentage of the population aged 65 and over increase over the period given. At the start of the period, American accounted for the highest proportion among three countries, while Japan is predicted that it will replace the United States in 2040.
Between 1940 and 2020, USA and Sweden experienced an oscillation in the percentage of people aged 65 and over. In 1940, around 10% of people in America aged 65 and over compared to about 8% in Sweden. While as, the number of Japanese people living considerably more than 65 just over 5% and this number is the lowest among three countries during this period.
In the next 20 years, the percentage of three countries are predicted that will almost increase. There was an dramatically growth in Japan in the 1930s with the highest percentage will be at 25%. In 2040, it is thought that nearly 28% Japanese will be 65 and more, while the figure for Sweden and the US will be more gradually lower at 25% and approximately 23% respectively.

Screenshot146.png
