thutra14101
Apr 24, 2020
Writing Feedback / The line graph compares the proportions of fertility in China and USA from 1920 to 2000 [2]
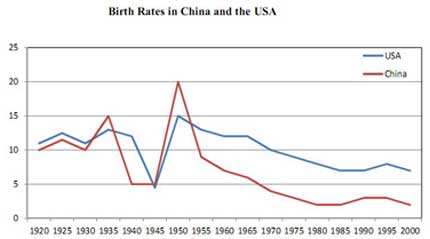
The line graph compares the proportions of fertility in China and The USA from 1920 to 2000.
It's clear that this research period witnessed significant fluctuations in the birth rates of both China and The USA, with lows during the 1940s and highs during the 1950s.
In the year 1920, the percentage of the birth in China was exactly 10%, while the figure for The USA was slightly higher, at over 10%. The period from the first year to 1935 experienced moderate increases in China and The USA, making up for around 15% and 13% respectively.
There were noticeable oscillations over the following 15 years. The proportion in fertility in The USA hit the bottom in 1945, at about 5% before reaching a peak of 15% after 5 years later. Meanwhile, the birth rate in China also touched the lowest point, at about 5% in 1940 and remained stable for 5 years. Between the next year and 2000, the percentage of the birth declined in two countries, with a plummet for China and a gradual drop for The USA.
changes in the birth rates of China and The USA
The line graph compares the proportions of fertility in China and The USA from 1920 to 2000.
It's clear that this research period witnessed significant fluctuations in the birth rates of both China and The USA, with lows during the 1940s and highs during the 1950s.
In the year 1920, the percentage of the birth in China was exactly 10%, while the figure for The USA was slightly higher, at over 10%. The period from the first year to 1935 experienced moderate increases in China and The USA, making up for around 15% and 13% respectively.
There were noticeable oscillations over the following 15 years. The proportion in fertility in The USA hit the bottom in 1945, at about 5% before reaching a peak of 15% after 5 years later. Meanwhile, the birth rate in China also touched the lowest point, at about 5% in 1940 and remained stable for 5 years. Between the next year and 2000, the percentage of the birth declined in two countries, with a plummet for China and a gradual drop for The USA.

ieltsreportbirthr.jpg
