Mrlong
May 27, 2020
Writing Feedback / (Ielts task1) how energy is used in an average Australian household and the greenhouse gas emissions [2]
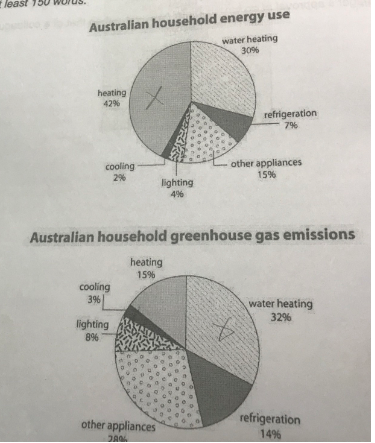
The first chart illustrates the percentage of Australian household energy use and the second chart describes the proportion of green house gas emissions released from this energy use.
Overall, in the first chart cooling makes up the smallest part of energy use, while heating is the largest segment. In the chart of greenhouse gas emissions, water heating is the most significant part and the lowest part is made by cooling.
In the first chart, heating accounts for 42% of energy use, being the largest part and other appliances and refrigeration are at 15% and 7%, respectively. However, only 4% of energy is used for lighting and cooling is the lowest part at 2%.
In the second chart, 32% of gas emissions released from from water heating, compared to 28 % of other appliances, 15 % of heating , and 14% of refrigeration, and the figures for gas emissions which result from cooling and lighting are much lower, with 3% and 8% respectively.
The two charts analysis
The first chart illustrates the percentage of Australian household energy use and the second chart describes the proportion of green house gas emissions released from this energy use.
Overall, in the first chart cooling makes up the smallest part of energy use, while heating is the largest segment. In the chart of greenhouse gas emissions, water heating is the most significant part and the lowest part is made by cooling.
In the first chart, heating accounts for 42% of energy use, being the largest part and other appliances and refrigeration are at 15% and 7%, respectively. However, only 4% of energy is used for lighting and cooling is the lowest part at 2%.
In the second chart, 32% of gas emissions released from from water heating, compared to 28 % of other appliances, 15 % of heating , and 14% of refrigeration, and the figures for gas emissions which result from cooling and lighting are much lower, with 3% and 8% respectively.

metqu8a.png
