duongtranah02
Aug 19, 2020
Writing Feedback / The Pie Chart - the proportion of water usage by various categories in Sydney, Australia (1997-2007) [3]
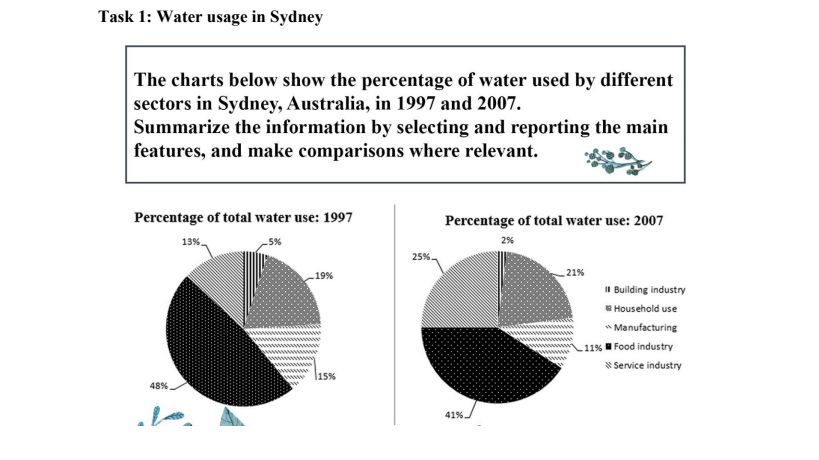
The chart compare the proportion of water usage by various categories in Sydney, Australia in 1997 and 2007
Overall, food industry accounted for the highest percentage of water use in sectors. Additionally, in terms of service industry, the proportion of total water use almost doubled.
In 1997, the figure for water consumption in food industry was exactly 48%. The amount of water used for manufacturing and building industry was much lower, at 15% and 5% respectively. There was a decline of water consumption in 3 sectors, the figure for food industry dropped slightly to 41%, compared to 11% and 2% of manufacturing and building industry respectively.
On the other hand, the period from 1997 to 2007 saw a increase in water usage in the other sectors ( service industry and households). While the percentage of water use in households rose significantly from 13% to 25%, there was a minimal climb in the amount of water consumed from 19% to 21%.
IELTS Writing task 1: Pie Chart
The chart compare the proportion of water usage by various categories in Sydney, Australia in 1997 and 2007
Overall, food industry accounted for the highest percentage of water use in sectors. Additionally, in terms of service industry, the proportion of total water use almost doubled.
In 1997, the figure for water consumption in food industry was exactly 48%. The amount of water used for manufacturing and building industry was much lower, at 15% and 5% respectively. There was a decline of water consumption in 3 sectors, the figure for food industry dropped slightly to 41%, compared to 11% and 2% of manufacturing and building industry respectively.
On the other hand, the period from 1997 to 2007 saw a increase in water usage in the other sectors ( service industry and households). While the percentage of water use in households rose significantly from 13% to 25%, there was a minimal climb in the amount of water consumed from 19% to 21%.

fr.png
